Like It Was All a Dream...
DHL Wealth Advisory - May 16, 2025
Well, let the good times roll… Not a sentence we thought would be opening our MWW commentary at this time last month. Global benchmarks have put together a string of four consecutive weekly gains on the back of continued progress...
Well, let the good times roll… Not a sentence we thought would be opening our MWW commentary at this time last month. Global benchmarks have put together a string of four consecutive weekly gains on the back of continued progress – this time real progress – on US geopolitics and trade.
Moving the market this week was the “Trade Deal” between the US and China. Coming into the meeting expectations were low that the two sides would come to agreement on trade, but rather hopes were simply for a continuation of dialogue between the two countries. Recall, the two had not spoken directly since the tariff onslaught started. Surprising market participants was an actual agreement that will see reciprocal tariff rates on both countries fall to just 10% from 125%. This effectively cuts the average effective tariff on U.S. imports from around 26% to 10%—still a fourfold increase from last year, but manageable.
This rate captures duty-free exempted goods, 10% baseline on most countries, 20% fentanyl levies on China, and 25% fees on steel, aluminum and some motor vehicles. Assuming the deal sticks, it would suggest some upgrade to economic growth outlook and a lighter inflation hit.
On the home front, we have seen a rushing of businesses to comply with the US-Mexico-Canada Trade Agreement (USMCA) Rules of Origin Condition. Previously, outside of a few core sectors (e.g., autos) that faced 0% most-favoured nation tariff, complying with the rule of origin seemed unnecessary. However, the March trade data highlights that after the fentanyl tariffs came into effect, both Canadian and Mexican firms quickly ramped up efforts to formally comply with USMCA. The average tariff rate on Canadian imports increased to 1.8% in March (from 0.1% in January). While that represents a relatively stark increase from virtually free trade between the two countries, it suggests that many firms worked quickly to meet USMCA conditions given that as of 2024, only 38% of Canadian exports to the U.S. came in under that agreement.
Mexico wasn’t far behind with the average tariff rate rising to 3.8% in March (versus 0.3% in January). In 2024, just over 50% of the value of goods exported from Mexico to the U.S. came in under USMCA.
The takeaway from this is that after the initial shock and awe tactic passed, exemptions were opened and businesses adjusted to comply with USMCA. We are not saying there isn’t still punitive action in place, but the thick fog of uncertainty and doubt has been lifted, or at least navigable.
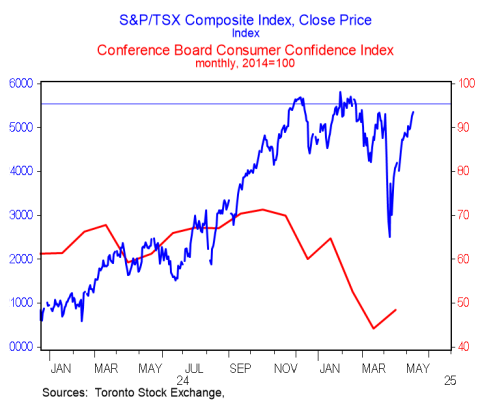
Will some of the less-bad vibes now filter through to sentiment more broadly? After all, both consumer and business confidence were severely rattled in Canada by the opening rounds of the trade war. By some measures, consumer confidence was at its lowest ebb in 60 years in March, before recovering slightly in April. As long as that plunge in sentiment did not translate into a dive in spending, the economy may still manage to now escape the worst. Take a look at the below reading of Consumer Confidence Index. It’s depressed, but it’s turning.

The China-U.S. trade news is at least indirectly positive for the Canadian economy and markets—a healthier global economy is supportive of commodity prices and Canadian exports. Equity markets have certainly taken on a healthier glow, with the TSX completely erasing the post-reciprocal-tariff sell-off, and now back within 1% of all-time highs.
The other major event to the week came on Tuesday with US CPI Inflation coming in not too hot and not too cool. Consumer inflation rebounded to some extent in April, but not as much as feared. The headline CPI increased 0.2% last month, lower than the consensus forecast of 0.3% as services and housing inflation remained firm last month, while goods, food, and energy prices were flat or lower for the most part.
Consumer inflation has generally been tame since the January 0.5% surge, though that is not expected to last in the months ahead as new tariffs once again start lifting goods prices and year-on-year comparisons become more difficult over the rest of Q2 and Q3. From a year ago, CPI inflation slipped to 2.3%, its lowest level since February 2021. This will be welcome news for the US Fed and keeps the door open for the Fed to cut interest rates later this year, should the labor market begin to falter.
Circling back to the market, the S&P 500 was up around 5% on the year through mid-February. It was more or less straight down from there. By the end of the first week in April the market was down more than 15%, good enough for a drawdown of 18.9% from peak to trough.
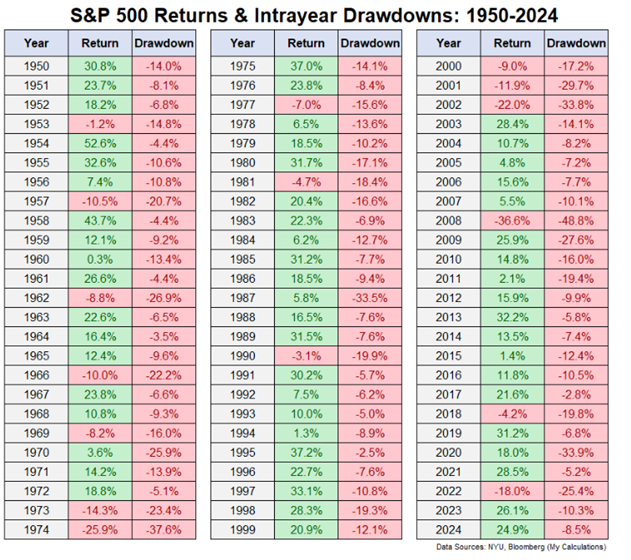
Now stocks are up nearly 15% from the lows and basically flat on the year – as measured by the S&P500. This is a classic puke and rally, which happens more often than you’d think. This is annual S&P 500 returns along with the intra-year peak-to-trough drawdowns:

This is a decent encapsulation of risk and reward. There can be green even when the red is pretty bad although sometimes the red ends in red. Consider the fact that there have been 41 years with a double-digit drawdown at some point since 1950.
There are obviously years when a drawdown leads to a poor outcome. In 16 of those 41 downdrafts, the S&P 500 finished the year down. Eight of those years were down double-digits.
That’s risk.
Now comes the interesting part. The market is often down but not out. We’ve had plenty of puke and rally situations. In those 41 years with a double-digit drawdown at some point during the year, the market finished with a gain 25 times or 61% of the time.
That’s an amazing win rate during years with a correction. And of those 25 years with double-digit drawdowns that finished in the black, 16 times the market ended the year with double-digit gains.
Think about these numbers. Years in which there is a correction of 10% or worse are more likely to finish the year with gains than losses. And the stock market also finished with way more double-digit gains than double-digit losses.
Corrections can be painful but they are not always the end of the world. It’s often very difficult to separate the reason for the correction from the correction itself. This one feels different because of the trade war and all of the uncertainty it has introduced.
But from a purely market history standpoint, the action in the stock market this year is perfectly normal.
Sources: BMO Economics EconoFACTS: U.S. Consumer Prices (April), U.S. CPI Inflation Remains Well Behaved, BMO Economics AM Charts: May 13, 2025 AM Charts for May 13, 2025, Fidelity presents VISION + Toronto Hybrid
The opinions, estimates and projections contained herein are those of the author as of the date hereof and are subject to change without notice and may not reflect those of BMO Nesbitt Burns Inc. ("BMO NBI"). Every effort has been made to ensure that the contents have been compiled or derived from sources believed to be reliable and contain information and opinions that are accurate and complete. Information may be available to BMO Nesbitt Burns or its affiliates that is not reflected herein. However, neither the author nor BMO NBI makes any representation or warranty, express or implied, in respect thereof, takes any responsibility for any errors or omissions which may be contained herein or accepts any liability whatsoever for any loss arising from any use of or reliance on this report or its contents. This report is not to be construed as an offer to sell or a solicitation for or an offer to buy any securities. BMO NBI, its affiliates and/or their respective officers, directors or employees may from time to time acquire, hold or sell securities mentioned herein as principal or agent. NBI will buy from or sell to customers securities of issuers mentioned herein on a principal basis. BMO NBI, its affiliates, officers, directors or employees may have a long or short position in the securities discussed herein, related securities or in options, futures or other derivative instruments based thereon. BMO NBI or its affiliates may act as financial advisor and/or underwriter for the issuers mentioned herein and may receive remuneration for same. A significant lending relationship may exist between Bank of Montreal, or its affiliates, and certain of the issuers mentioned herein. BMO NBI is a wholly owned subsidiary of Bank of Montreal. Any U.S. person wishing to effect transactions in any security discussed herein should do so through BMO Nesbitt Burns Corp. Member-Canadian Investor Protection Fund.