It's Official: Next Presidential Debate to Take Place At The Driving Range.
DHL Wealth Advisory - Jun 28, 2024
North American markets were higher on the week as investors took profit on the high-flying semiconductor trade and moved funds elsewhere. A welcome sign for market participants was a broadening out of the rally this week...
North American markets were higher on the week as investors took profit on the high-flying semiconductor trade and moved funds elsewhere. A welcome sign for market participants was a broadening out of the rally this week – something we discussed in last week’s edition. Thus far in June market gains had largely been concentrated in the technology sector.
Meanwhile in Canada this week we had May CPI Inflation data that ran counter to what we have seen thus far in 2024 and put to risk a possible July cut out of the Bank of Canada. Canadian consumer prices rose 0.6% in May, or +0.3% in seasonally adjusted terms, well above expectations and lifting the headline rate two ticks to 2.9% vs 2.7% expectation. This is the first time in 2024 that Canadian inflation has landed decisively on the high side of consensus, and is clearly a step in the wrong direction.
Source: BMO Economics EconoFACTS: Canadian CPI (May)
Core inflation was no better, as both of the major metrics the BoC watches rose 0.3% m/m, also lifting the y/y rates to just below 3%. The median rate rose two ticks to 2.8%, while the trim mean nudged up a tick to 2.9% (which was actually as expected, as the prior month was revised down a tenth to 2.8%).
Source: Traders scale back bets of July BoC rate cut after unexpectedly hot inflation report - Globe & Mail
Markets immediately responded to the unexpected acceleration by sending the Canadian dollar higher, while domestic bond yields spiked as traders scaled back bets on the odds of another interest rate cut in July. Expectations are now 45% for a second rate cut by the Bank of Canada on July 24. They stood at 65% prior to inflation report. Some 50 basis points of additional easing is now priced into the market by the end of this year, which is modestly less than before this morning’s inflation data.
Source: BMO Economics EconoFACTS: Canadian CPI (May)
Here’s how implied probabilities of future interest rate moves stand in swaps markets. The Bank of Canada overnight currently sits at 4.75%. While the bank moves in quarter point increments, credit market implied rates fluctuate more fluidly and are constantly changing. Columns to the right are percentage probabilities of future rate moves.

Source: Traders scale back bets of July BoC rate cut after unexpectedly hot inflation report - Globe & Mail
No bones about it, this is not what the Bank of Canada wanted to see at this point, and clearly shaves the odds of a follow-up July rate cut. However, it doesn't rule out such a move, as we will see one more CPI (next one is July 16, eight days before the July 24 rate decision). With inflation back on a bumpy path, the outlook for BoC moves is similarly bumpy. For now, our official call remains that the next BoC rate cut will be in September, and this report does nothing to move that needle.
Source: BMO Economics EconoFACTS: Canadian CPI (May)
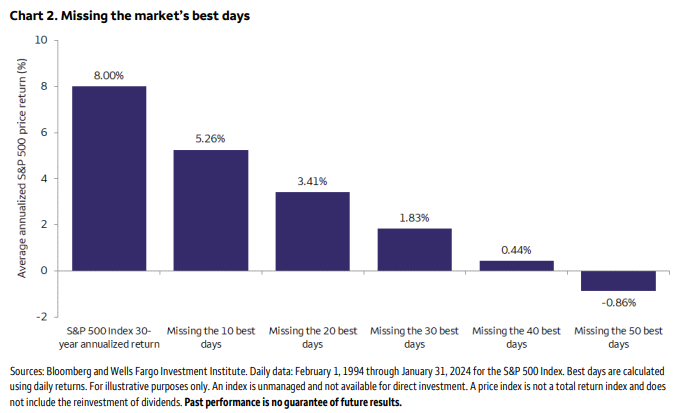
Stepping back from our ad nauseum discussion on interest rates and inflation, we always field a lot of question from clients when accounts are trading at or near record territory. Afterall, as we close out the second quarter of 2024, most of our discretionary mandates are currently near/at all-time-highs. Some people ask what to do next? We saw an interesting chart this week that speaks to the merits of a long-term focused buy and hold strategy. From time-to-time it’s always good to revisit the data behind this theory.
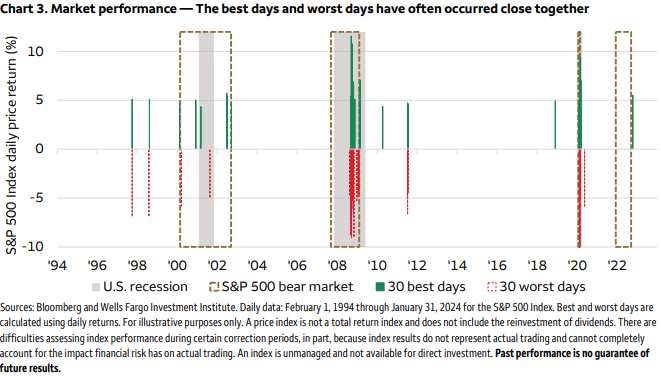
Research suggests that missing a handful of the best days over longer time periods drastically reduces the average annual return an investor could gain by simply holding on to their equity investments during times of market volatility. Over the past 30 years, missing the best 30 days would take the average annual return of the S&P 500 down from 8% per year to 1.8%. Going further sitting in cash and missing the best 40 days took average returns down to a mere 0.44%. Naturally you wonder how can one stay invested for only the best days but avoid the words days (buy a lottery ticket while you’re at it). Interestingly, the best days tend to coincide with some of the worst days during a bull market. Of the 10 best trading days in terms of percentage gains, all 10 took place during recessions and six also coincided with a bear market with three of those in the 2020 recession and the remaining during the Great Recession of 2007-2009. Some of you might recall the first few months of the pandemic in 2020. It wasn’t uncommon to see a 5% market pullback followed by a 5% market rally the very next day. The point being here that disentangling the best and worst days can be quite difficult, if not impossible, since they occur in a very tight time frames and sometimes even on consecutive trading days (Covid).

While market volatility has come down from elevated levels in the 2022 bear market, several economic and market uncertainties remain that may contribute to an uptick in volatility (take last nights debacle of a Presidential debate, for instance). Even as the market reaches new highs, it continues to grapple with the potential for an economic slowdown, the timing and amount of rate cuts, and the lingering impacts of still-elevated inflation and interest rates. As risks remain, we suggest focusing on quality while always keeping your long-term objectives in mind.

While market volatility has come down from elevated levels in the 2022 bear market, several economic and market uncertainties remain that may contribute to an uptick in volatility (take last nights debacle of a Presidential debate, for instance). Even as the market reaches new highs, it continues to grapple with the potential for an economic slowdown, the timing and amount of rate cuts, and the lingering impacts of still-elevated inflation and interest rates. As risks remain, we suggest focusing on quality while always keeping your long-term objectives in mind.
The opinions, estimates and projections contained herein are those of the author as of the date hereof and are subject to change without notice and may not reflect those of BMO Nesbitt Burns Inc. ("BMO NBI"). Every effort has been made to ensure that the contents have been compiled or derived from sources believed to be reliable and contain information and opinions that are accurate and complete. Information may be available to BMO Nesbitt Burns or its affiliates that is not reflected herein. However, neither the author nor BMO NBI makes any representation or warranty, express or implied, in respect thereof, takes any responsibility for any errors or omissions which may be contained herein or accepts any liability whatsoever for any loss arising from any use of or reliance on this report or its contents. This report is not to be construed as an offer to sell or a solicitation for or an offer to buy any securities. BMO NBI, its affiliates and/or their respective officers, directors or employees may from time to time acquire, hold or sell securities mentioned herein as principal or agent. NBI will buy from or sell to customers securities of issuers mentioned herein on a principal basis. BMO NBI, its affiliates, officers, directors or employees may have a long or short position in the securities discussed herein, related securities or in options, futures or other derivative instruments based thereon. BMO NBI or its affiliates may act as financial advisor and/or underwriter for the issuers mentioned herein and may receive remuneration for same. A significant lending relationship may exist between Bank of Montreal, or its affiliates, and certain of the issuers mentioned herein. BMO NBI is a wholly owned subsidiary of Bank of Montreal. Any U.S. person wishing to effect transactions in any security discussed herein should do so through BMO Nesbitt Burns Corp. Member-Canadian Investor Protection Fund.