The Verdict Is In... Guilty. Of a Bullish Outlook.
DHL Wealth Advisory - May 31, 2024
North American markets gave back some gains this week following a string of gains over four of the last five weeks. It was a quiet week for major economic data with the focus of markets on the winding-up of Q1 earnings...
North American markets gave back some gains this week following a string of gains over four of the last five weeks. It was a quiet week for major economic data with the focus of markets on the winding-up of Q1 earnings. It’s worth remembering that when you remove all the noise, what drives share prices is earnings growth and the expectation of profitability, current or future.
This year the expectation is for S&P 500 earnings to grow by a solid 10%-11%, well above last year's 1% growth rate. We have gotten through most of the first-quarter earnings season, and once again corporate earnings growth did not disappoint. Over 95% of S&P 500 companies have reported earnings, and of these, nearly 80% have exceeded earnings expectations, above the long-term average rate of 77%. Earnings growth for the quarter is now forecast to come in at a healthy 6%, above the expectation for 3.5% growth at the start of the quarter.
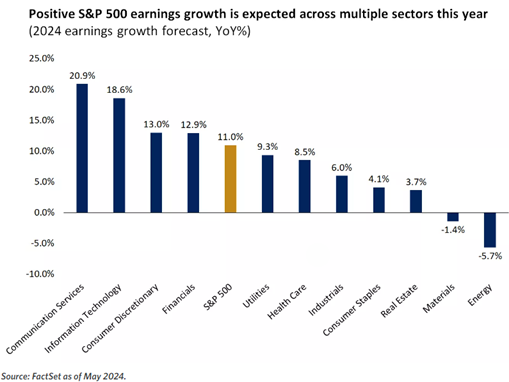
The below chart illustrates the sectors of the market expected to deliver the most earnings growth. It shows the strength of market strength right now with all, but two sectors expected to grow earnings. You’ll also notice the strength of the market with Discretionary and Technology leading the way forward.

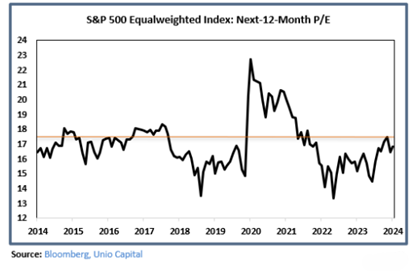
Interestingly, while pockets of the market are expensive (e.g “tech/tech-weighted indices) – the average company in the S&P 500 is not. The chart below shows the equal weighted S&P 500 index is trading slightly below its 10-year average P/E, on a next 12-month basis. Perhaps even more surprising is that it’s currently trading 18% below where it traded in Q1/2021, this pours cold water on anyone claiming the market is in a bubble.

Meanwhile, despite lagging the S&P 500 year to date, we believe the TSX remains poised to reverse course and begin to overtake its neighbour to the south for the remainder of 2024. As a reminder, BMO Chief Investment Office Brian Belski recently increased both his S&P 500 and S&P/TSX price targets to 5,600 and 24,500, respectively. These new targets imply a near 5.5% return for the S&P 500 and a solid 9.5% return for the S&P/TSX into year-end.
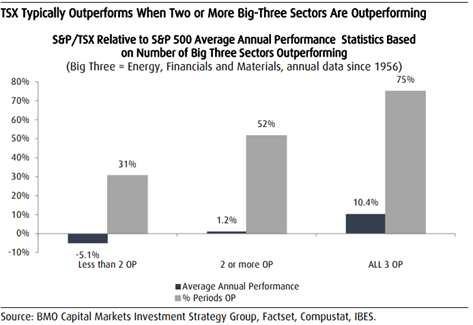
Indeed, as we have discussed frequently over the last few quarters, we believe that a significant catch-up trade will eventually transpire in Canada. To be more specific, we believe the upside in Canadian equities will be driven by the strong relative value position, improving fundamental sentiment, returning foreign flows and the overall broadening of equity performance from the US mega-caps. Furthermore, when we analyze current Canadian index performance, two of the three largest sectors in the TSX (Energy and Materials) are already sharply outperforming the TSX this year. In fact, Belski’s work shows the TSX typically outperforms the SPX when two out of three are outperforming and rarely underperforms when ALL three of the big-three sectors are working.

Furthermore, since 1956 the TSX outperformed the S&P 500 by over 10% on average in years when ALL three of these sectors were outperforming. Yes, while Financials are frankly languishing year to date, the sector is outperforming year over year. This suggests to us that Financials will likely reverse course much sooner than most investors believe and will begin outperforming as the year unfolds. Lastly, we believe there is significant room for a catch-up trade in the other non-big three sectors, which will also support the TSX strong returns in the second half of the year.
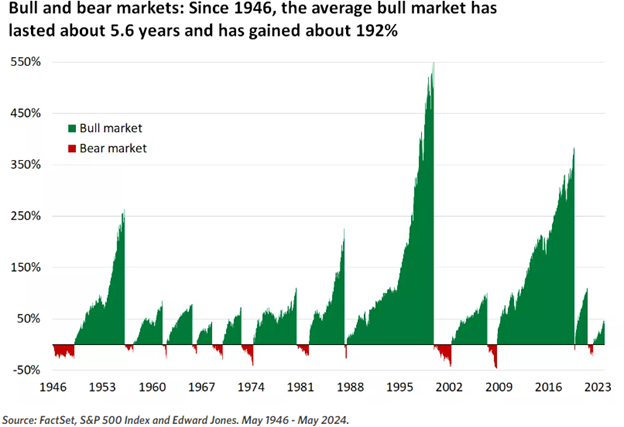
Given the volatility that we witnessed in early April and again here the last 2 weeks, we thought it would be a good idea to remind readers that historically bull markets are longer and stronger than bear markets (markets that are down 20% or more). In fact, since 1946, the average S&P 500 bear market has lasted about 16 months with average declines of 34%, while the average bull market has lasted about 5.6 years, with average gains of 192%. Even removing the longest two bull markets, the average bull market lasts about 4.3 years and gains 125%. Given that this current bull market started in October 2022, we are a little over 1.5 years into this cycle with the S&P 500 up about 48% over that time, history tells us that we may still have some time and price appreciation ahead of us.

The opinions, estimates and projections contained herein are those of the author as of the date hereof and are subject to change without notice and may not reflect those of BMO Nesbitt Burns Inc. ("BMO NBI"). Every effort has been made to ensure that the contents have been compiled or derived from sources believed to be reliable and contain information and opinions that are accurate and complete. Information may be available to BMO Nesbitt Burns or its affiliates that is not reflected herein. However, neither the author nor BMO NBI makes any representation or warranty, express or implied, in respect thereof, takes any responsibility for any errors or omissions which may be contained herein or accepts any liability whatsoever for any loss arising from any use of or reliance on this report or its contents. This report is not to be construed as an offer to sell or a solicitation for or an offer to buy any securities. BMO NBI, its affiliates and/or their respective officers, directors or employees may from time to time acquire, hold or sell securities mentioned herein as principal or agent. NBI will buy from or sell to customers securities of issuers mentioned herein on a principal basis. BMO NBI, its affiliates, officers, directors or employees may have a long or short position in the securities discussed herein, related securities or in options, futures or other derivative instruments based thereon. BMO NBI or its affiliates may act as financial advisor and/or underwriter for the issuers mentioned herein and may receive remuneration for same. A significant lending relationship may exist between Bank of Montreal, or its affiliates, and certain of the issuers mentioned herein. BMO NBI is a wholly owned subsidiary of Bank of Montreal. Any U.S. person wishing to effect transactions in any security discussed herein should do so through BMO Nesbitt Burns Corp. Member-Canadian Investor Protection Fund.