Not Since Patrick Swayze Made Jennifer Grey Fly
DHL Wealth Advisory - Jul 28, 2023
Markets continued their march higher this week, and in dramatic fashion. The Dow Jones Industrial Average finally ran out of steam Thursday as investors cashed in following an historic streak of 13 straight gains....
Markets continued their march higher this week, and in dramatic fashion. The Dow Jones Industrial Average finally ran out of steam Thursday as investors cashed in following an historic streak of 13 straight gains. If it had gained a 14th day on Thursday, the index would have tied its record winning streak going way back to 1897. Regardless, the 13-day streak goes all the way back to 1987 when Dirty Dancing dominated the box office. Thursday could have been quite historic, tying a streak not seen in 126 years when Queen Victoria reigned and a year after the Dow was created. Back then, the Dow listed just 12 stocks; it expanded to 30 stocks in 1928.
The move higher came even as the US Federal Reserve hiked interest rates to the highest in 22 years on Wednesday. Investors took the rate hike in stride as Fed Chair Jerome Powell said that the central bank could raise rates again or hold them steady at these levels depending on the data. And the data continues to show positive momentum in terms of GDP growth and slowing inflation. The latest US gross domestic product reading Thursday showed a rise of 2.4% in the second quarter, which was better than the 2% increase expected by economists. Meanwhile Friday morning saw inflation cool further in June with the personal consumption expenditures (PCE) price index excluding food and energy increased just 0.2% from the previous month. So-called core PCE rose 4.1% from a year ago, coming in better than the estimate for 4.2%. The annual rate was the lowest since September 2021 and marked a decrease from the 4.6% pace in May.
The data reinforces other recent releases showing that, at least compared with the soaring inflation from a year ago, prices have begun to ease. Readings such as the consumer price index are showing a slower rise in inflation, while consumer expectations also are also coming back in line with longer-term trends. Fed officials follow the PCE index closely as it adjusts for changing behavior from consumers and provides a different look at price trends than the more widely cited CPI. Along with the inflation data, the US Commerce Department said personal income rose 0.3% while spending increased 0.5%. Meanwhile consumer Income came in slightly below expectations, while spending was in line. Investors and Fed officials alike want to see income numbers come in lower as it means wage pressures and costs are beginning to ease. The US central bank meets again in September and the market is betting that upcoming data will cause the Fed to back off.
Despite mixed signals around the near-term path for the economy, there are reasons for investors to be optimistic about the markets, even as growth is orchestrated to slow. Markets are forward looking, just as investors should be when it comes to keeping portfolios in alignment with financial goals.
Looking at the comparison between the earnings yield on stocks and the yield on bonds, we've seen that relationship trend toward levels similar to prior stock-market recoveries that began in 2009 and 2018. This is no guarantee that the coast is clear, but we believe that despite risks of recession, investors can have confidence that a durable bull market will ultimately take shape.
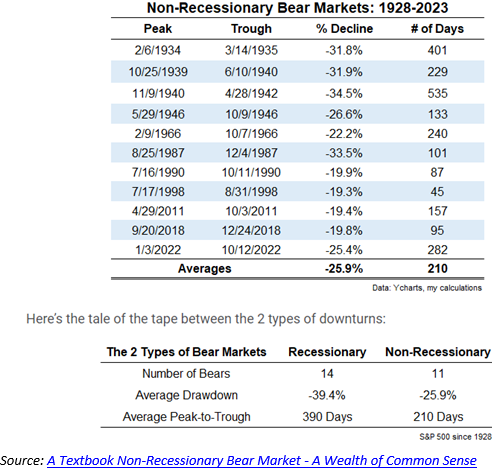
Additionally, we've seen the breadth and leadership of the market rally broaden out more recently, including gains among cyclical sectors and investments, which is another encouraging sign. Interestingly, there’s a growing conversation amongst market pundits that the structural bull market that we saw reset in 2020 is still alive and well. If you look at a list of the non-recessionary bear markets, the fact that we bottomed in October 2022 and have spent the last nine months repairing makes a lot of sense.

Global Outlook
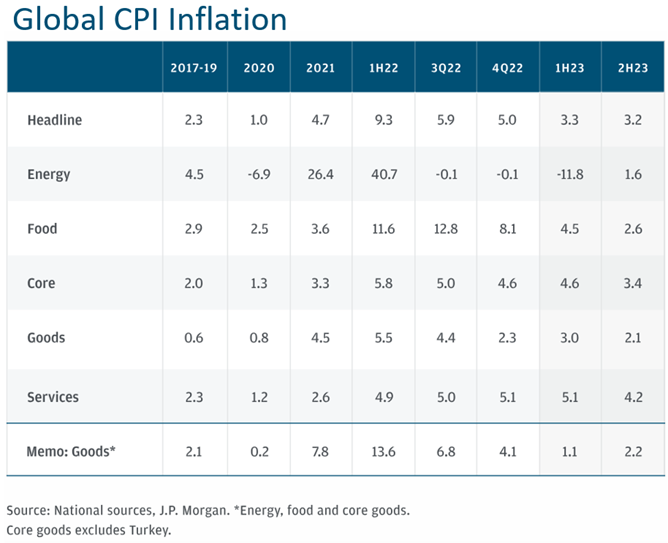
Inflation is anticipated to slow in the second half of 2023, while global economic growth will likely weaken. In the first half of 2023, the rate of global economic growth climbed to 2.8%. Fading supply disruptions triggered by the COVID-19 outbreak and Russia's invasion of Ukraine have been able to offset the strain of monetary tightening. While we are seeing inflation decline, we do not expect to see a fall to central bank comfort levels for the time being. Core inflation is expected to be resilient at above 3% globally through 2024 and the pressure on central banks will remain considerable.

Canadian Market
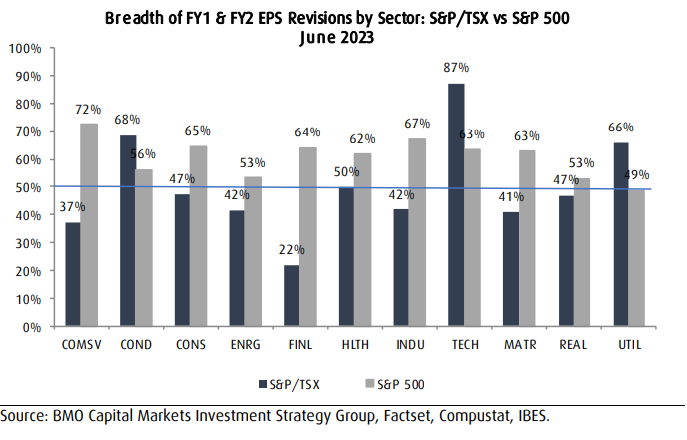
Year to date, US equities, measured by the S&P500, have outperformed Canadian equities, measure by the S&P/TSX, widely driven by AI growth and EPS estimates. S&P/TSX growth expectations have been slow to rebound with NTM EPS growth estimates stagnant since the end of 2022. This is direct contrast with the S&P 500, which has seen NTM EPS growth estimates rebound in the first half of the year. This is a key reason for the continued valuation spread between Canada and the US. On a sector basis, almost all the S&P 500 sectors are showing breadth of EPS revisions above 50%, while Analysts remain very cautious across most sectors in Canada. Given the sharp underperformance in the first half of the year strategists are reiterating their Canadian value proposition as a key advantage for Canadian equities. As recession and interest rate fears begin to subside, we expect to see confidence come back into earnings expectations which will be a catalyst for an expansion on Canadian valuation. We believe the TSX is well positioned to outperform global markets as valuations normalize over the coming years. We will be looking for value positions that show improving outlooks and positive revision trends.

US Market
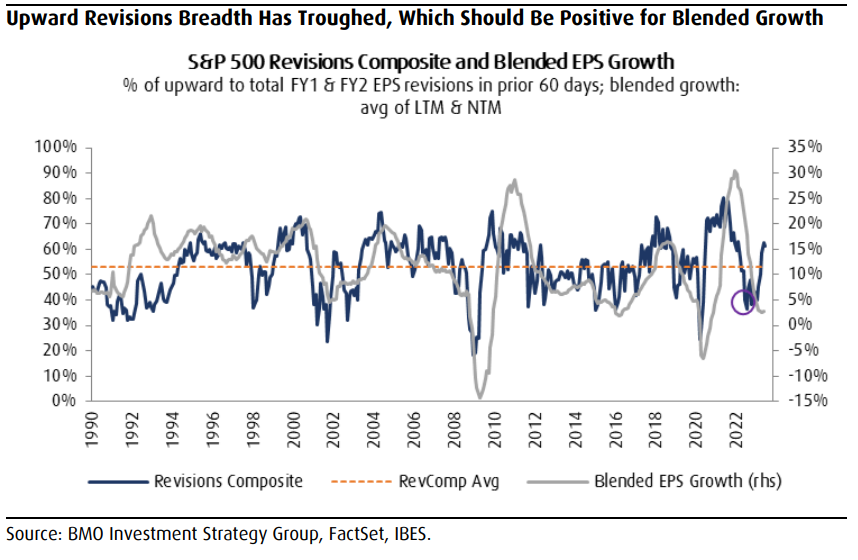
While the S&P 500 is sitting just above many analysts’ base case year-end target, we believe that US equities can still finish the year at higher levels as many bull case assumptions have become more credible. Be that as it may, uncertainty is very present, so we do expect price choppiness for the remainder of the year. Selectivity will be key, as we are leaning towards value which appears extremely oversold compared to growth. Earnings growth will likely remain sticky for the remainder of the year which should bring down inflation expectations and let the Fed step back. Investors should care more about falling inflation than zero earnings growth for the near term. Revision trends support the suggestion that 2Q23 represents the growth trough for this earnings cycle and we expect strong acceleration into 2024.

July Revisions
Added
Canadian Natural Resources (CNQ)
We added to our existing position in Canadian Natural Resources. CNQ boasts the lowest breakeven oil price among its peers and is able to fund its sustaining capital and dividend if WTI drops to the low US$40/bbl. CNQ is also expected to have one of the strongest free cash flow profiles in its peer group, giving it enhanced flexibility to increase returns to shareholders. Canadian Natural has roughly 7,400 mmbbl of proven reserves, which represents ~40% of its corporate reserves. Combined with its bitumen reserves, analysts estimate the company has an oil sands asset life of over 50 years, which is far above its large-cap oil sands peer average of around 30 years. We believe this gives Canadian Natural a significant edge as its longer-term production profile is supported by an existing resource base, negating the need to pursue M&A opportunities or expand capital budgets to ensure organic reserve growth.
Purpose Global BD FD ETF (BND)
Feeling that global central banks are at, or near, to their rate hiking campaign, we feel now is the time for investors to increase their fixed income allocations. With that point in mind, we initiated a new position in the Purpose Global Bond ETF. BND is Purpose’s biggest bond ETF and one of its fastest growing names this year, taking in about $100m of net inflows. It is an actively managed strategy that holds a basket of global investment grade bonds, with a yield of 4.69%. BND is designed to achieve positive total returns without additional risk by enhancing bond yields and managing duration across a broad range of investment grade fixed income securities.
Aritzia (ATZ)
We took advantage of an abrupt market selloff to add to our position in Aritzia. Aritzia is a fashion retailer and design house of women’s apparel brands, operating through Canadian and U.S. geographical segments. We view Aritzia as an attractive consumer growth story with a unique market position and strong U.S. growth opportunity. The recent unexpected shift to a period of infrastructure investments, as well as moderating sales growth, is expected to weigh on F2024E EBITDA, but the long-term U.S. growth opportunity outweighs the near-term margin headwinds. Our key catalysts continue to be ongoing comparable sales growth, driven by expansions/relocations; new store openings in Canada and the U.S.; higher e-commerce penetration; expansion into new product categories.
Sell
Suncor (SU)
We high-graded our energy position by selling out of Suncor. Suncor's operational track record has been somewhat lackluster over the last few years, which has pushed many investors to the sidelines. Despite the company possessing peer-leading downstream operations, we believe it still has a lot of work to do to get back into investors' good graces, and, as a result, we have decided to high-grade our energy exposure. Poor performance at Fort Hills, coupled with the looming Base Mine depletion date, has created an overhang on the share price. We believe Suncor's shares will continue to underperform its large cap Canadian peers until these issues are resolved.
The opinions, estimates and projections contained herein are those of the author as of the date hereof and are subject to change without notice and may not reflect those of BMO Nesbitt Burns Inc. ("BMO NBI"). Every effort has been made to ensure that the contents have been compiled or derived from sources believed to be reliable and contain information and opinions that are accurate and complete. Information may be available to BMO Nesbitt Burns or its affiliates that is not reflected herein. However, neither the author nor BMO NBI makes any representation or warranty, express or implied, in respect thereof, takes any responsibility for any errors or omissions which may be contained herein or accepts any liability whatsoever for any loss arising from any use of or reliance on this report or its contents. This report is not to be construed as an offer to sell or a solicitation for or an offer to buy any securities. BMO NBI, its affiliates and/or their respective officers, directors or employees may from time to time acquire, hold or sell securities mentioned herein as principal or agent. NBI will buy from or sell to customers securities of issuers mentioned herein on a principal basis. BMO NBI, its affiliates, officers, directors or employees may have a long or short position in the securities discussed herein, related securities or in options, futures or other derivative instruments based thereon. BMO NBI or its affiliates may act as financial advisor and/or underwriter for the issuers mentioned herein and may receive remuneration for same. A significant lending relationship may exist between Bank of Montreal, or its affiliates, and certain of the issuers mentioned herein. BMO NBI is a wholly owned subsidiary of Bank of Montreal. Any U.S. person wishing to effect transactions in any security discussed herein should do so through BMO Nesbitt Burns Corp. Member-Canadian Investor Protection Fund.