"Why Can't You Get a Job" - The Offspring's take on Economics.
DHL Wealth Advisory - Jul 07, 2023
North American markets finished lower in the holiday shortened week. A much stronger-than-expected ADP Private Sector report on Thursday increased investors’ anxiety around the state of the economy and path of interest rates....
North American markets finished lower in the holiday shortened week. A much stronger-than-expected ADP Private Sector report on Thursday increased investors’ anxiety around the state of the economy and path of interest rates. Private sector jobs increased by 497,000 in June, which was the biggest monthly gain since July 2022. June’s increase was more than double the 220,000 that economists had been expecting and far better than the downwardly revised 267,000-job addition seen in May. As a result of the report, the 2-year U.S. Treasury yield hit a 16-year high in Thursday’s session.
Source: BMO Economics EconoFACTS: U.S. ISM Services PMI (June)
The good news is bad news trade was on as markets are now pricing in a ~90% chance of a Federal Reserve hike later this month. However, don't ever take one job indicator as the be-all and end-all (example: payrolls, household employment, claims, job openings, layoffs, ADP, ISM surveys). The private sector report is quite frankly, a little unbelievable. Or is it? Small businesses accounted for over half of the hiring (+299,00). And, by industry, leisure & hospitality accounted for nearly half (+232,000), which is a little more believable. Moreover, job openings fell more than expected in May, according to a Labor Department report. That data could provide hope that the tight job market may be seeing at least some loosening.
Then there was Friday’s nonfarm payrolls which flew in the face of most other job indicators as private payrolls growth slowed sharply. The nonfarm payroll report is largely seen as the best overview of employment in the total US economy. Well, nonfarm payrolls rose 209,000 in June, downshifting from the 278,000 averages of the first half of the year and the 399,000 norm in 2022 that was boosted by re-openings. Moreover, the previous two large monthly gains were revised down by a total of 110,000, suggesting a somewhat softer jobs market than previously thought. Further, private sector employment rose the least since the pandemic restrictions of late 2020, just 149,000, a sharp pullback from 259,000 the prior month. Health care and construction were big contributors, while retailers cut positions for the third time in four months, possibly hinting at slower consumer spending (outside of autos). Bottom Line: The US labour market appears to be cooling but not fast enough to prevent another tap on the brakes from the Fed on July 26.
Source: BMO Economics EconoFACTS: U.S. Nonfarm Payrolls (June)
Moves in equities this year have been predominantly driven by expectations for U.S. Fed rate hikes, so January's rally was dashed first by an exceptionally strong U.S. jobs report in early February (reigniting fears of persistent inflation and more Fed tightening) and then additionally by the U.S. bank crisis in March, culminating in an 8% pullback in the S&P 500. From there, however, the rally has resumed, powered by expectations for an approaching end to the Fed's rate-hiking campaign. The S&P 500 is now up roughly 20% and the TSX is higher by ~12% since mid-October, recouping a sizable portion of last year's bear market drop.
Despite all the noise and air of uncertainty around the economic and monetary policy, market swings have been rather quiet for much of 2023. The VIX index, a measure of market volatility, has declined fairly steadily and includes reaching its lowest level last week since before the pandemic. In fact, Yahoo market data shows that there have been just two days this year in which the market has moved by more than 2% (one up, one down), and 43 of the last 46 trading days (94%) have seen the stock market move by less than 1%. For some context, last year saw 110 trading days where the market swung by more than 1%. There were 251 trading days in 2022 so that’s 43.8% of the time!
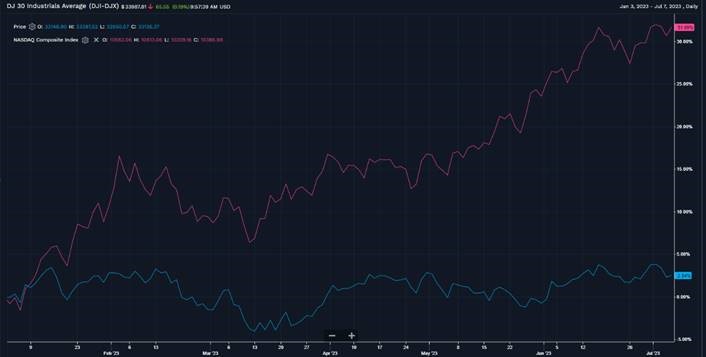
Performance so far has been defined by relief on the rising-rate front. This has filtered through equities by way of a strong rebound in technology and growth investments, which were punished last year. This was evident in the divergence in performance between the tech-heavy Nasdaq and the Dow. The below image shows the year-to-date return of the NASDAQ (~32%) vs Dow Jones (2.5%).

We continue to be of the view that the economy will slow ahead, but that last year's bear market lows discounted a mild economic recession, meaning equities don't have to return to prior lows even as the economy exhibits some weakness. The economic data is encouraging of a soft landing where an economy slows but doesn’t necessarily enter a recession. Hard landings happen fast and are aggressive, something that we know hasn’t yet occurred.
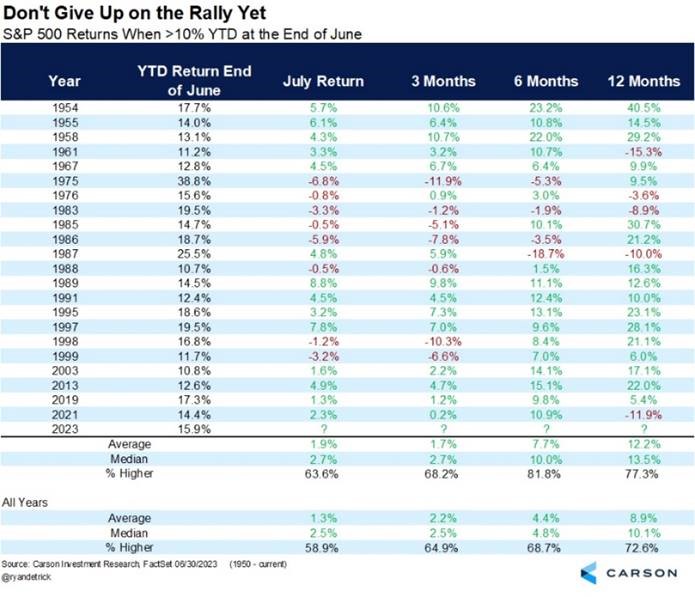
We opined that coming into 2023 the foundation for a new bull market would begin to form as the year advanced, and we think the data provides reasons for investors to be optimistic about the second half of 2023. And when simply looking at the historical data: Since 1950, when the S&P 500 is up >10% in the first 6-months of the year, these returns have tended to persist. Market returns for July and the next 3-, 6- and 12- month were much better than average (see chart below). Additionally, in the most recent 11 occurrences where this has happened, the next 6-months has been higher every single time.

The opinions, estimates and projections contained herein are those of the author as of the date hereof and are subject to change without notice and may not reflect those of BMO Nesbitt Burns Inc. ("BMO NBI"). Every effort has been made to ensure that the contents have been compiled or derived from sources believed to be reliable and contain information and opinions that are accurate and complete. Information may be available to BMO Nesbitt Burns or its affiliates that is not reflected herein. However, neither the author nor BMO NBI makes any representation or warranty, express or implied, in respect thereof, takes any responsibility for any errors or omissions which may be contained herein or accepts any liability whatsoever for any loss arising from any use of or reliance on this report or its contents. This report is not to be construed as an offer to sell or a solicitation for or an offer to buy any securities. BMO NBI, its affiliates and/or their respective officers, directors or employees may from time to time acquire, hold or sell securities mentioned herein as principal or agent. NBI will buy from or sell to customers securities of issuers mentioned herein on a principal basis. BMO NBI, its affiliates, officers, directors or employees may have a long or short position in the securities discussed herein, related securities or in options, futures or other derivative instruments based thereon. BMO NBI or its affiliates may act as financial advisor and/or underwriter for the issuers mentioned herein and may receive remuneration for same. A significant lending relationship may exist between Bank of Montreal, or its affiliates, and certain of the issuers mentioned herein. BMO NBI is a wholly owned subsidiary of Bank of Montreal. Any U.S. person wishing to effect transactions in any security discussed herein should do so through BMO Nesbitt Burns Corp. Member-Canadian Investor Protection Fund.