MWW - Earnings Go Boom (Still)
DHL Wealth Advisory - Oct 23, 2026
- Investment Services
- Portfolio Management
- Special Reports and Newsletters
- Total Client Experience
- Wealth Management
North American markets were in the red this week as investors continued to sell the AI theme and all its proxies. In recent weeks we have been talking about the seasonality headwind that September and October have historically provided...
North American markets were in the red this week as investors continued to sell the AI theme and all its proxies. In recent weeks we have been talking about the seasonality headwind that September and October have historically provided, compounded by this years’ US Midterms, markets have had a lot to grapple.
At face value that’s not great but there’s a lot to like about the technical set-up right now. For example, breadth has been steadily expanding with the percentage of S&P 500 stocks trading above their 50-day moving averages climbing from 20% at the beginning of the month to more than 50% as of this morning. At the same time other broad measures of equity participation such as the Russell 2000 and NYSE Composite are also rebounding from successful tests of their rising 200-day moving averages. Seasonality is about to become a strong tailwind again as November to January is the strongest consecutive three months of the year with average returns of 4.30% for the S&P 500 and 4.33% for the S&P/TSX Composite. And finally, it appears that a significant peak developing in long-term interest rates that could see the U.S. 10-year yield push steadily lower into the new year, perhaps as low as its 200-day moving average currently at 4.51%. That will be a tailwind for everything that's pulled back since August including small and mid-caps, utilities, pipelines, financials, REITs. (Interest sensitive stocks account for approximately 40-45% of the weight of the S&P/TSX Composite.)
All of that to say, while the near-term outlook is muddled by the different technical set-ups for headline indexes the weight of the evidence suggests the remainder of the year should be quite constructive for risk assets. We continue to recommend putting money to work during any weakness that develops between now and the U.S. mid-term elections. Recall the stats we highlighted at the beginning of the month: “Since 1950 the S&P 500 has been higher 12 months past the election in every single instance with an average return of +15%. The average return from the election to the highest high within the following 12 months is +22.6% with only one instance where the return was less than 10%.”
That’s the technical side of things. Let’s now turn our attention to fundamentals: Earnings. We’re only about 10% into the Q3 earnings season, but the results have been strong to start, while expectations are even stronger. Consensus is looking for 30% y/y growth in S&P 500 earnings in Q3. Energy is adding significantly with profits in that sector expected to more than double. Stripping out energy though, earnings growth is still expected at +26% y/y. Hyperscalers are also adding heavily, driving profits in technology and communication services up by an expected 67% and 46%, respectively. As we’ve noted before, these earnings numbers appear to be juiced by circular deals and various mark-to-market gains. And, the massive capex currently underway is not yet depreciating through the bottom line. Hence, cash flow in the S&P 500 hasn’t exploded higher the same way that reported earnings per share have. For now though, it’s all systems go on earnings into the Q3 reporting period…
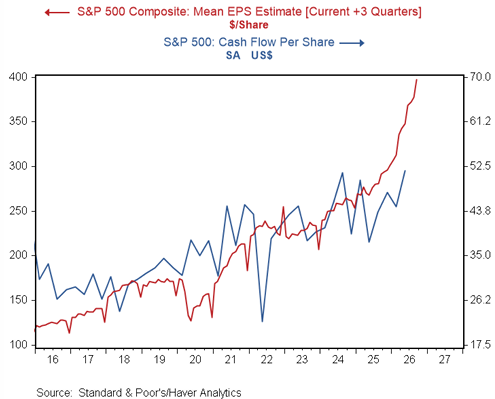
Diving into this a bit deeper, the current growth rate in S&P 500 forward earnings stands at 37%. Friendly reminder that anything in double-digit territory is usually considered “great” and we are, well, significantly beyond “great” territory. This is the type of growth rate seen coming out of recessions after earnings have declined and they are normalizing. The growth rate has only been higher once in the history of forward earnings: in the wake of the financial crisis as they recovered from being cut nearly in half. We are living through extraordinary times, and most people are unlikely to see something like this in the course of their careers. That’s the good news. The “not-so-good” news is that this type of backdrop comes with consequences. Indeed, there’s a pretty clear relationship between earnings growth and inflation historically. In that vein, some parts of the story are somewhat “normal”.
Thus far in 2026, market returns remain good, not great. That said, gains have been harder to come by since Fed expectations began to change in the early summer months. Indeed, the S&P 500 gained 10.7% in the first five months of the year and are flat since. We’ll say that again, the market has oscillated between small gains and losses the last five months. A healthy breather, in our opinion. But note that investor sentiment usually remains supportive in situations like this.
Some of you may ask "is all this earnings growth largely attributed to the “Mag 7", like prior years?". The answer is decidedly NO. Breadth of estimate revisions is quite strong, and all 11 sectors are expected to post positive earnings growth this quarter, according to FactSet, with Energy, Information Technology, Communication Services, and Materials leading the way. When we look at the historical pattern of Q3 revisions, they typically fall throughout the year until reporting begins. This year looks quite different. Today, major indices across the capitalization spectrum have seen their earnings revisions improve all year. The Mag 7 is still expected to have an incredibly strong quarter (33.2% y-o-y versus about 28% for the other 493 companies), but in terms of revisions, they have posted the weakest improvement year to date.
Leading indicators have been pointing to an improving economic backdrop for some time and now we are seeing a similar trend in coincident indicators like Industrial Production (IP). Our analysis shows the growth in top-line revenue for both the Mag 7 and the rest of the Index are tracking IP. It’s clear that the Mag 7 is moving in sync with the economy, but the S&P 493 is as well. Again, this is a broad-based phenomenon and not just driven by AI hype. All 11 sectors are also projected to report annual growth in revenues, led by the Information Technology, Energy, and Communication Services sectors. Like EPS revisions, analysts have raised their revenue estimates during the current quarter. The complete S&P 500 Index is now expected to report year-over-year revenue growth of 12.3%, while that number was 10.9% just four months ago.
Ending on the conversation around how central banks play into the equation. After all, next week we very well may see the first rate increase out of the Bank of Canada since July 2023. We expect that the Federal Reserve and Bank of Canada will have tough decisions to make in their upcoming meetings on whether to raise interest rates or hold them steady. They will likely have to weigh elevated inflation rates against potentially better recent trends in inflation and well-anchored inflation expectations.
For investors, however, we know that a good defense against higher inflation is to invest in assets that can outpace inflation rates over time. In our view, a diversified portfolio across market caps, regions, and sectors can set up investors for positive after-inflation rates of return. We continue to favour U.S. large-cap stocks, Canadian small-and-mid-cap stocks, and emerging market equities.
Also, keep in mind that even if the central banks decide to raise rates one or even two times, we don't believe this would derail the broader narrative. The U.S. and Canadian economies are growing at or above trend levels, and corporate earnings growth for both the S&P 500 and the Canadian TSX are on pace for over 25% this year. In this backdrop, we believe the economy would be able to absorb a mid-cycle adjustment in interest rates, especially if it helps bring credibility to the central bank and pushes inflation expectation lower.
Sources: BMO Capital Markets Portfolio Strategy "The Extraordinary Earnings Backdrop... and Its Consequences!"; BMO Capital Markets Economic Research "Earnings Go Boom (Still)"
The opinions, estimates and projections contained herein are those of the author as of the date hereof and are subject to change without notice and may not reflect those of BMO Nesbitt Burns Inc. ("BMO NBI"). Every effort has been made to ensure that the contents have been compiled or derived from sources believed to be reliable and contain information and opinions that are accurate and complete. Information may be available to BMO Nesbitt Burns or its affiliates that is not reflected herein. However, neither the author nor BMO NBI makes any representation or warranty, express or implied, in respect thereof, takes any responsibility for any errors or omissions which may be contained herein or accepts any liability whatsoever for any loss arising from any use of or reliance on this report or its contents. This report is not to be construed as an offer to sell or a solicitation for or an offer to buy any securities. BMO NBI, its affiliates and/or their respective officers, directors or employees may from time to time acquire, hold or sell securities mentioned herein as principal or agent. NBI will buy from or sell to customers securities of issuers mentioned herein on a principal basis. BMO NBI, its affiliates, officers, directors or employees may have a long or short position in the securities discussed herein, related securities or in options, futures or other derivative instruments based thereon. BMO NBI or its affiliates may act as financial advisor and/or underwriter for the issuers mentioned herein and may receive remuneration for same. A significant lending relationship may exist between Bank of Montreal, or its affiliates, and certain of the issuers mentioned herein. BMO NBI is a wholly owned subsidiary of Bank of Montreal. Member-Canadian Investor Protection Fund. Any U.S. person wishing to effect transactions in any security discussed herein should do so through BMO Nesbitt Burns Corp.