MWW - Happy Thanksgiving!
DHL Wealth Advisory - Oct 09, 2026
- Investment Services
- Portfolio Management
- Special Reports and Newsletters
- Total Client Experience
- Wealth Management
This scribe is back into the regular swing of things following two weeks of vacation, but the markets didn’t get the memo. The last few weeks have seen long-term bond yields reach multidecade highs, diesel prices have climbed to record levels...
This scribe is back into the regular swing of things following two weeks of vacation, but the markets didn’t get the memo. The last few weeks have seen long-term bond yields reach multidecade highs, diesel prices have climbed to record levels, and the Federal Reserve reversed course by raising interest rates in September after both pundits and financial markets entered the year expecting multiple rate cuts. Yet, many of the fundamental forces supporting markets over the past year remain intact. Corporate profit growth remains robust, the global economy has proven resilient, and investment related to artificial intelligence continues to support economic growth and markets. Instead, we’ll unpack the latest economic data, examine what history suggests about stock-market performance following sharp increases in bond yields, and consider what these trends could mean for investors in the final stretch of the year. But first, the million-dollar question when the Fed initially raises rates is: how many hikes lie ahead? Truth be told, consensus typically takes its cues from the Fed at these times, and the Fed’s message is almost always the same … “we might have to raise rates one or two more times.” I am paraphrasing a little bit here, but this is essentially the message that we got from Chairman Warsh a few weeks ago. It is eerily similar to the comments Alan Greenspan made in June of 2004 after the Fed’s first hike of that cycle. In that instance, there were 17 rate hikes in total. Not one or two, 17! The reality is that the Fed tends to be reactive, and they usually tighten policy as long as labor markets are tightening. Worded differently, they hike as long as underlying inflation remains on an upswing. This is what’s really behind the “for how long and how much?” question. On that front, the picture continues to improve. Inflation remains above target and nobody would argue otherwise, but recent trends are encouraging. Last week's Personal Consumption Expenditures (PCE) report, the inflation gauge most closely monitored by the Federal Reserve, showed core prices rising 3.0% year-over-year in August. More importantly, the shorter-term trend has moderated significantly. On a three-month annualized basis, core PCE slowed to 2.0%, marking the first time in over two years that it has aligned with the Fed's target. The six-month annualized rate also eased to 2.7%, its lowest reading since late last year.
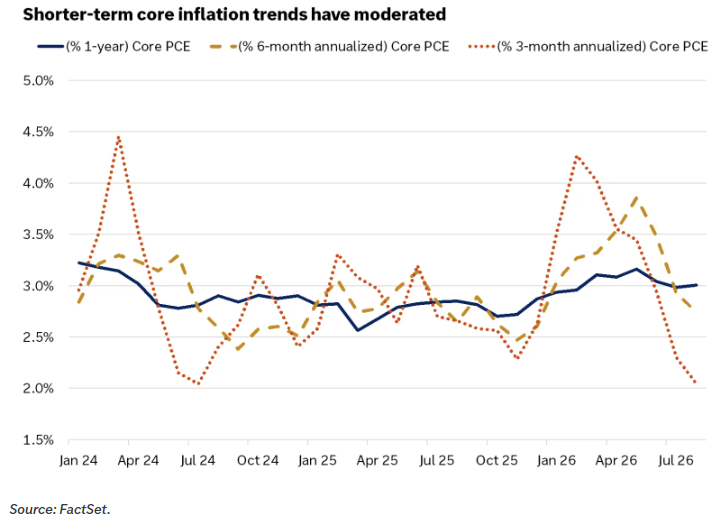
Still, at 3.0%, core inflation remains uncomfortably high for U.S. policymakers, particularly amid lingering uncertainty in the Middle
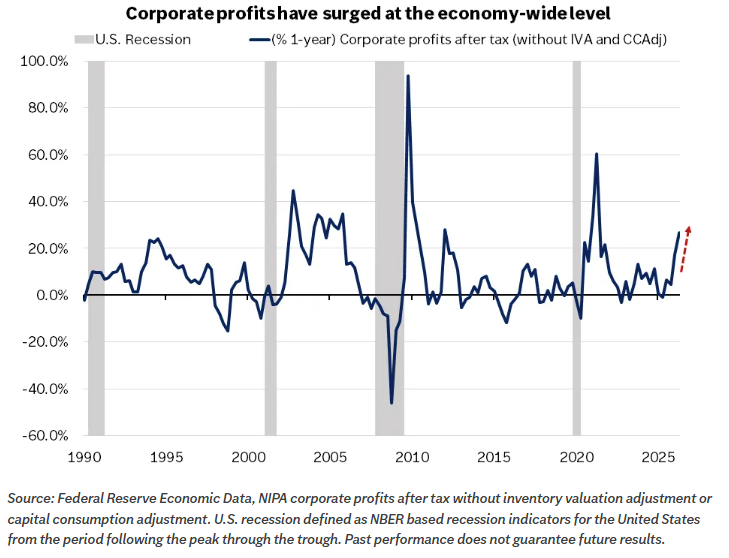
East and signs from last week’s ISM Manufacturing survey that input-price pressures remain elevated. However, encouraging PCE data over recent months, softer-than-expected U.S. employment figures, and dovish-leaning comments from Federal Reserve officials tempered expectations for another rate hike in October. While these developments may give policymakers greater flexibility over the timing of future moves, lingering geopolitical risks and still above-target inflation suggest to us that the Fed's hiking cycle is not yet complete. Economists’ base case calls for two additional rate increases, which we see as a midcycle adjustment rather than the start of a more aggressive tightening cycle. Turning to the driver of growth, Economic momentum remains resilient. US consumer spending has remained strong in recent months, with real personal consumption rising 0.6% in August and 2.6% from a year earlier. In addition, second-quarter U.S. real GDP growth was revised higher, from annualized rate of 1.5% to 2.2%, primarily reflecting upward revisions to consumer spending along with stronger investment. Meanwhile, corporate profitability has been another important source of support. Earnings for TSX-listed companies are expected to grow more than 25% this year, while S&P 500 earnings are projected to increase by over 30%. Encouragingly, this earnings momentum is no longer concentrated solely within a handful of mega-cap technology companies. Broad-based measures of corporate profitability tell a similar story. U.S. National Income and Product Accounts (NIPA) profits recorded one of the strongest year-over-year gains outside of post-recession recoveries since 2012 during the second quarter.
Certainly, risks remain. Higher borrowing costs, tighter financial conditions, and ongoing geopolitical tensions all warrant attention.
However, recent economic and corporate data suggest that the underlying backdrop remains constructive. In our view, that resilience should continue to provide meaningful support for equity markets through the remainder of the year. Lastly, we fielded a question from a client recently: “Are you still anticipating a broad market pullback leading into the mid-terms?” To be honest it’s mostly already happened... It’s just been masked by the heavy weight technology stocks in the S&P 500. Case in point: the Equal Weight S&P 500 was down 7.2% at one point last week while broader measures of equity performance such as the Russell 2000 index were down 9.6%. Going further, the ratio of 52-week new lows to 52-week new highs is a staggering 5:1. The good news is that some of the indicators we watch when looking for a trading low are now at/near the levels we expect them to be. For example, the percentage of stocks on the NYSE trading above their 50-day moving averages tagged the important 20% threshold while the percentage of S&P 500 stocks came very close to doing so last week as well. At the same time, indexes such as the NYSE Composite, Russell 2000, S&P Mid-Cap 400, and Small-Cap 600 all tested their rising 200-day moving averages, which is a fairly textbook medium-term pullback.
Sources: BMP Private Wealth Portfolio Advisory Team - Daily Action Report
The opinions, estimates and projections contained herein are those of the author as of the date hereof and are subject to change without notice and may not reflect those of BMO Nesbitt Burns Inc. ("BMO NBI"). Every effort has been made to ensure that the contents have been compiled or derived from sources believed to be reliable and contain information and opinions that are accurate and complete. Information may be available to BMO Nesbitt Burns or its affiliates that is not reflected herein. However, neither the author nor BMO NBI makes any representation or warranty, express or implied, in respect thereof, takes any responsibility for any errors or omissions which may be contained herein or accepts any liability whatsoever for any loss arising from any use of or reliance on this report or its contents. This report is not to be construed as an offer to sell or a solicitation for or an offer to buy any securities. BMO NBI, its affiliates and/or their respective officers, directors or employees may from time to time acquire, hold or sell securities mentioned herein as principal or agent. NBI will buy from or sell to customers securities of issuers mentioned herein on a principal basis. BMO NBI, its affiliates, officers, directors or employees may have a long or short position in the securities discussed herein, related securities or in options, futures or other derivative instruments based thereon. BMO NBI or its affiliates may act as financial advisor and/or underwriter for the issuers mentioned herein and may receive remuneration for same. A significant lending relationship may exist between Bank of Montreal, or its affiliates, and certain of the issuers mentioned herein. BMO NBI is a wholly owned subsidiary of Bank of Montreal. Member-Canadian Investor Protection Fund. Any U.S. person wishing to effect transactions in any security discussed herein should do so through BMO Nesbitt Burns Corp.