MWW - Corrections: Uncomfortable, Unavoidable, but Always Temporary
DHL Wealth Advisory - Mar 27, 2026
- Investment Services
- Portfolio Management
- Special Reports and Newsletters
- Total Client Experience
- Wealth Management
North American markets saw a fifth consecutive week of declines, the longest such streak since May 2022.
Markets remain on edge as the Iran conflict has markets moving in the opposite direction of the sharp swings in oil prices. Recent attacks on Middle East energy infrastructure triggered the first 5% pullback in the S&P 500 and TSX this year, underscoring investor sensitivity to escalating geopolitical risks. Brent crude, the European benchmark for global oil pricing, briefly retested its $120 highs, while WTI, the U.S. benchmark, climbed toward $100.
How quickly things change. At the start of the year, our biggest concern was that Wall Street strategists (including us) had reached an almost uniformly bullish consensus. Most pointed to solid GDP growth, easing inflation, stimulative business and personal tax cuts in the U.S., plus upticks in defense and infrastructure spending in a host of other countries. Companies had weathered the 2025 threats from U.S. tariff and trade policy well and were on track to continue double-digit earnings increases. The growth was fueled by both steady consumer spending and blossoming technological change. Investors were also largely constructive (albeit a bit nervous) in the wake of three years of strong double-digit gains in stock markets.
However, the ink was barely dry on our New Year’s resolutions when the first surprises landed: the seizing of Venezuelan President Nicolás Maduro; installation of new leadership; and redirection of oil resources in Venezuela. A host of other events also occurred. They ranged from major (war in Iran, technological breakthroughs in new AI models) to unusual (a Sunday night video released by the chairman of the U.S. Federal Reserve and a dystopian scare story about an AI jobs apocalypse).
Today, we are amidst the largest disruption to global oil markets on record, and central banks now face a policy dilemma: respond to the upside risks to inflation or the downside risks to the labor market? While the ultimate trajectory of the conflict remains uncertain, we offer the following perspective on the potential economic, Fed, BoC, and market implications.
Much will depend on the duration of the conflict and the persistence of the disruption to energy markets. If the rise in oil prices proves sustained, or accelerates further, downside risks to the North American economy would increase. Higher energy prices effectively act as a tax on consumers, eroding purchasing power and weighing on discretionary spending. Every additional dollar spent at the pump is a dollar not spent elsewhere.
With consumer spending accounting for nearly 70% and 60% of U.S. and Canada's economic activity respectively, a prolonged energy-driven squeeze would likely slow growth. That said, any moderation would be occurring against a backdrop of an economy that had entered this period on relatively solid footing, in our view. And with Canada being a significant net exporter of oil, rising global energy prices will benefit Canadian producers, government revenues, and the broader resource sector. On the inflation front, higher energy prices would lift headline inflation and further complicate the outlook for central banks.
While the Iran conflict has created a major oil shock, today’s backdrop is fundamentally different from the one that produced the stagflation of the 1970s for several reasons.
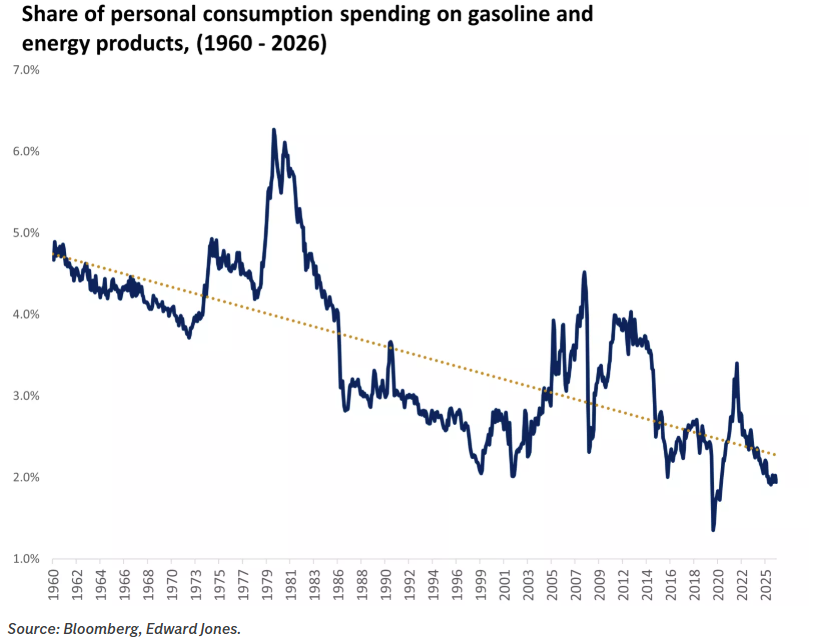
- Energy is a smaller drag on consumers than it used to be — Energy spending as a share of total consumer spending is materially lower than it was during the 1970s and early 1980s (roughly 2% today versus about 6% then), suggesting that the direct hit to household purchasing power from a given oil shock is smaller today.
- Canada and the U.S. are far more insulated on the supply side — Canada has been exporting energy for decades, the U.S. has been a net exporter of oil since 2019, and North American natural-gas prices have remained relatively insulated from the disruption, even as Europe and Asia face a supply crunch. Canadian and U.S. producers stand to benefit from higher prices, even if that support does not fully offset the drag from weaker consumer spending.
- Oil still matters, but less in a services-based economy — Large oil-price moves still hurt, but the global economy is simply less oil-intensive than it was during the original energy crises. Since 1950, the amount of energy required to produce one unit of GDP has fallen by roughly 70%, reflecting efficiency gains and the growing importance of the services sector.
The market reaction in March has been to de-risk. However, our avid readers will have heard us say this many times now, but corrections are natural, normal and part of a healthy functioning market. There’s an old adage that you’ll never get rich off a savings account. The saying illustrates the fundamental relationship underpinning markets: risk of some sort is implied if you are seeking a higher return – no free lunches here. The key is understanding the various types of risk and working to ensure that your expected return adequately compensates for it.
Potential return comes from share price appreciation and dividends. The upside is theoretically unlimited, meaning equities can be a solid hedge against the ravages of long-term inflation. We all relearned over the past five years that inflation is an insidious thief, steadily chipping away at purchasing power, year in and year out. Yet equity markets have always been the best inflation hedge for investors, with average annual returns that have steadily outpaced inflation. The key word that sentence being “average”. There will always been periods where equity markets face a curveball and investors question the merits of staying in the batter’s box.
To that point, we offer the below table. Something we shared earlier in the year. Though equity investors obsess (a lot) over interim pullbacks, intra‑year pullbacks are not anomalies — they are normal market “toll roads”. A ~10–15% decline intra‑year is historically consistent with long‑term bull markets, not evidence that something is “wrong.” As many strategists note, volatility is the price paid for long‑term equity returns.
≥ 5% pullback: Happens in almost every year (≈95%+ of years)
≥ 10% correction: Occurs in more than half of all years
≥ 15% drawdown: Roughly one out of every three years on average
≥ 20% bear‑market decline: About once every 5–6 years historically.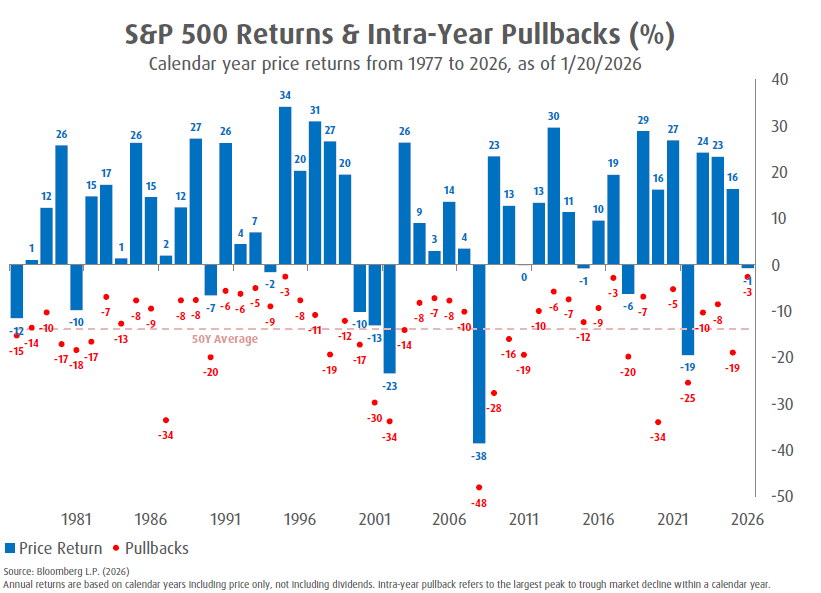
Despite these regular declines, the S&P 500 finishes the year positive about 70–75% of the time. In the past ~40–45 years, the index ended higher in roughly 3 out of every 4 years, even though those same years still experienced double‑digit pullbacks. Since 1955, intra-year declines have averaged ‑13.9%, while annual returns were positive in 51 of 70 years.
Sources:Weekly Strategy Perspectives – A BMO Private Wealth Publication
The opinions, estimates and projections contained herein are those of the author as of the date hereof and are subject to change without notice and may not reflect those of BMO Nesbitt Burns Inc. ("BMO NBI"). Every effort has been made to ensure that the contents have been compiled or derived from sources believed to be reliable and contain information and opinions that are accurate and complete. Information may be available to BMO Nesbitt Burns or its affiliates that is not reflected herein. However, neither the author nor BMO NBI makes any representation or warranty, express or implied, in respect thereof, takes any responsibility for any errors or omissions which may be contained herein or accepts any liability whatsoever for any loss arising from any use of or reliance on this report or its contents. This report is not to be construed as an offer to sell or a solicitation for or an offer to buy any securities. BMO NBI, its affiliates and/or their respective officers, directors or employees may from time to time acquire, hold or sell securities mentioned herein as principal or agent. NBI will buy from or sell to customers securities of issuers mentioned herein on a principal basis. BMO NBI, its affiliates, officers, directors or employees may have a long or short position in the securities discussed herein, related securities or in options, futures or other derivative instruments based thereon. BMO NBI or its affiliates may act as financial advisor and/or underwriter for the issuers mentioned herein and may receive remuneration for same. A significant lending relationship may exist between Bank of Montreal, or its affiliates, and certain of the issuers mentioned herein. BMO NBI is a wholly owned subsidiary of Bank of Montreal. Any U.S. person wishing to effect transactions in any security discussed herein should do so through BMO Nesbitt Burns Corp. Member-Canadian Investor Protection Fund.