Pop Quiz: Avg Bull Market is How Long?
DHL Wealth Advisory - Jul 18, 2025
Markets continued their march into record territory this week buoyed by fresh economic data reports along with a slew of corporate earnings releases. Quarterly earnings reports released this week have exceeded Wall Street’s expectations...
Markets continued their march into record territory this week buoyed by fresh economic data reports along with a slew of corporate earnings releases. Quarterly earnings reports released this week have exceeded Wall Street’s expectations, fueling investor confidence. Around 50 S&P 500 components have reported thus far, with 88% of those exceeding analysts’ expectations, FactSet data shows.
Key data releases on Thursday reflected strength in the U.S. economy. The Labor Department reported Thursday that jobless claims for the week ending July 12 came out at 221,000, marking a decrease of 7,000 from the previous week. Separately, retail sales in June rose more than expected as consumers found their mojo. Retail sales were up 0.6% from May, beating the 0.2% estimate and the best monthly performance since March. The tariff truce, slow roll on tariff hikes, and low unemployment found consumers returning to the stores and spending again.
Elsewhere on the economic resiliency front, U.S. industrial production climbed more than expected, up 0.3% in June. That marked the first gain in four months and the fastest pace since February. For all of Q2, industrial production slowed to a 0.3% rate after tariff front-running resulted in a 1.1% gain in the prior quarter—which was the fastest in more than three years.
We spoke in our commentary last week that this week would be telling for the possibility of a surprise July rate cut. Well, odds are that rates will be holding steady for at least a couple more months. On Tuesday we saw Canada’s June CPI that was broadly as expected, if not even a touch below, at 1.9% on headline and 3.1% on the median. But in the current situation, as-expected is not mild enough to prompt the Bank of Canada off the sidelines in July. BMO’s economics team is now pencilling in rate trims in the September, December and March/26 meetings. If Ottawa manages to arrange a trade framework with Washington in the meantime, they would likely pull one of those cuts.
Our neighbours to the south saw data that wasn’t much different. The mostly as-expected U.S. June CPI report didn’t settle the debate about the inflationary impact of tariffs. Headline prices increased 0.3%, with a similar move in food costs perhaps hinting at some small tariff effect. Core consumer prices rose 0.23%, slightly less than expected as new vehicle prices reversed lower for a third straight month, despite hefty levies, likely because dealers are working through pre-tariff inventory. The heating up of US inflation in June, while close to expectations, is a step in the wrong direction that will keep the Federal Reserve on the sidelines at the upcoming July FOMC meeting.
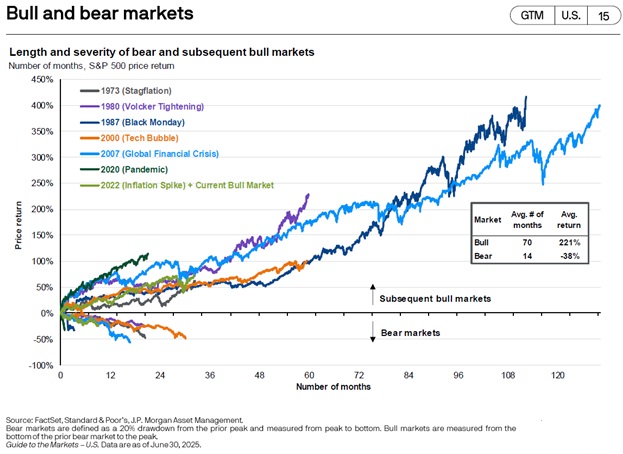
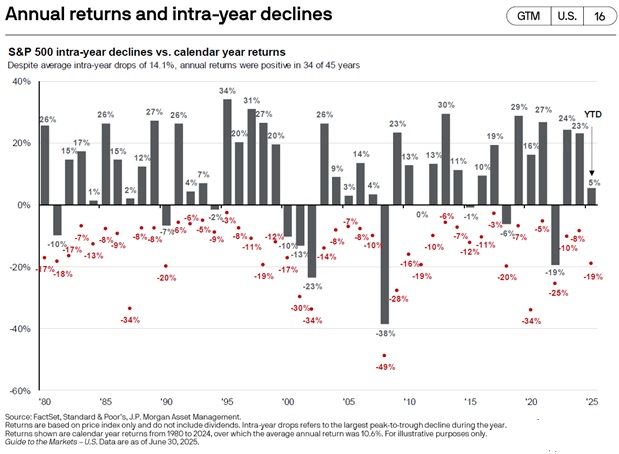
Lastly, JP Morgan released their Guide to the Markets for Q3/2025 this week and it’s jammed packed with great charts that illustrate the longevity of bull markets and that volatility, while uncomfortable, is a natural part of every market cycle.
We are around month 36 of the current bull market that started in October of 2022 when the market bottomed on fears of inflation and aggressive interest rate hikes out of Global Central banks. The average bull market the last 50 years has averaged 70 months with average returns of 221%. At month 36 we are in the 60% neighbourhood for returns. Goes to say if history is any guide, this market has time and room to run.


Sources: BMO Economics AM Charts: July 16, 2025, BMO Economics EconoFACTS: U.S. Consumer Prices (June), BMO Economics EconoFACTS: Canadian CPI (June)
The opinions, estimates and projections contained herein are those of the author as of the date hereof and are subject to change without notice and may not reflect those of BMO Nesbitt Burns Inc. ("BMO NBI"). Every effort has been made to ensure that the contents have been compiled or derived from sources believed to be reliable and contain information and opinions that are accurate and complete. Information may be available to BMO Nesbitt Burns or its affiliates that is not reflected herein. However, neither the author nor BMO NBI makes any representation or warranty, express or implied, in respect thereof, takes any responsibility for any errors or omissions which may be contained herein or accepts any liability whatsoever for any loss arising from any use of or reliance on this report or its contents. This report is not to be construed as an offer to sell or a solicitation for or an offer to buy any securities. BMO NBI, its affiliates and/or their respective officers, directors or employees may from time to time acquire, hold or sell securities mentioned herein as principal or agent. NBI will buy from or sell to customers securities of issuers mentioned herein on a principal basis. BMO NBI, its affiliates, officers, directors or employees may have a long or short position in the securities discussed herein, related securities or in options, futures or other derivative instruments based thereon. BMO NBI or its affiliates may act as financial advisor and/or underwriter for the issuers mentioned herein and may receive remuneration for same. A significant lending relationship may exist between Bank of Montreal, or its affiliates, and certain of the issuers mentioned herein. BMO NBI is a wholly owned subsidiary of Bank of Montreal. Any U.S. person wishing to effect transactions in any security discussed herein should do so through BMO Nesbitt Burns Corp. Member-Canadian Investor Protection Fund.