TSX; Eh-Okay.
DHL Wealth Advisory - Jun 13, 2025
- Investment Services
- Portfolio Management
- Special Reports and Newsletters
- Total Client Experience
- Wealth Management
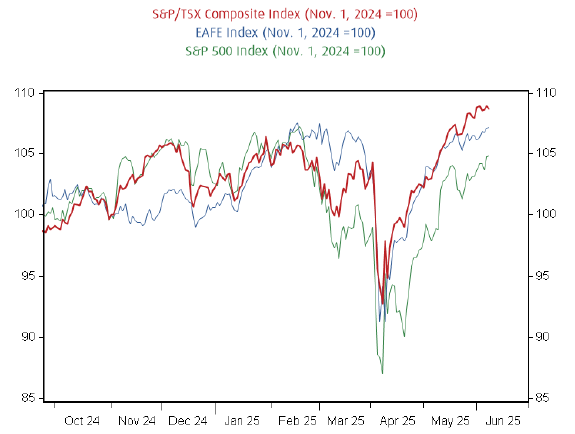
The TSX saw another week of record highs despite ongoing uncertainty over the economic fallout from the trade war. In fact, since the start of November (just before the U.S. election), the TSX has outperformed both the S&P 500 and the EAFE index...
The TSX saw another week of record highs despite ongoing uncertainty over the economic fallout from the trade war. In fact, since the start of November (just before the U.S. election), the TSX has outperformed both the S&P 500 and the EAFE index—not bad for a country highly exposed to U.S. trade. Some factors:
- The worst-case outcome was priced in back in early April and, through a combination of carve-outs for U.S. tariffs on Canada, and a presumed eventual trade deal, the ultimate reality will bite much less hard.
- Those areas that are still under heavy tariff pressure (e.g., steel & aluminum and autos) are a small slice of the Canadian equity market. The TSX is notoriously not a perfect reflection of the underlying Canadian economy.
- Canadian stocks were relatively cheap coming into 2025.
- Support from past BoC easing is still trickling out. Unlike the Fed, the BoC has carved rates down to neutral territory

Source: BMO Economics AM Charts: June 11, 2025
What’s more interesting is the broadness of the rally with the TSX 60 (large caps), TSX Completion (midcaps), and TSX Small Cap indexes all rising to all-time highs. On the latter, we note the index has finally cleared its 2007 peak.
We don't think this rally is built on sand, as it is supported by still-solid fundamentals. Trade tensions have eased, policy focus has shifted toward tax cuts, and economic data remain resilient. And corporate profits continue to grow at a healthy pace (more on that below). That said, valuations have completed a full round trip, which could foster a sense of complacency and leave less margin for error as growth decelerates. Nevertheless, we think markets are appropriately beginning to look ahead, setting their eyes on the possibility of more stimulative fiscal and monetary policies in 2026.
With respect to earnings, first quarter earnings season is in the books, underscoring corporate strength. Despite macroeconomic headwinds and headline volatility, S&P 500 and TSX companies delivered solid results, growing profits 12.5% and 16.5% year-over-year. While earnings growth estimates for 2025 have been revised down, the 2026 outlook remains steady, pointing to the potential for reacceleration.
Notably, the forward 12-month earnings estimate has recently reached a new high in the U.S., providing a fundamental anchor for rising equity markets. While valuations have undoubtedly contributed to the recent gains, earnings appear to have also played an important role in supporting the rally from the bottom.
A pull forward in demand ahead of higher tariffs may have boosted first-quarter results. Still, much of the upside came from the three growth sectors - information technology, communication services and consumer discretionary - which together account for over 50% of the S&P 500. Tech earnings grew 20%, communication services surged 33%, and consumer discretionary rose 8%, helping to restore investor confidence in this part of the market that fell briefly out of favour earlier this year.
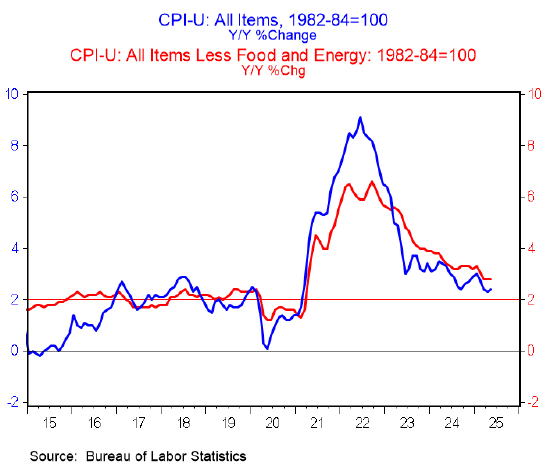
Meanwhile, on Wednesday we had US Consumer inflation data for the month of May that remained, increasing only 0.1% on both the headline and core measures. The consensus had been looking for +0.2% and +0.3% respectively. We received the expected weakness in gasoline (-2.6%) and energy prices (-1.0%). But we also got an unexpectedly favorable cooling in services (+0.2%) and housing (+0.3%) inflation too. The tariff-driven consumer inflation pop that we’ve all been bracing for hasn’t really shown up in the hard data… yet. The annual rate now stands at 2.4% (remember the days of 9%?). Given that most of the extreme tariffs are on pause (for now?), firms are generally holding off on passing higher costs to consumers.

Sources: BMO Economics AM Charts: June 11, 2025, BMO Economics AM Charts: June 12, 2025, BMO Economics EconoFACTS: U.S. Consumer Prices (May)
The opinions, estimates and projections contained herein are those of the author as of the date hereof and are subject to change without notice and may not reflect those of BMO Nesbitt Burns Inc. ("BMO NBI"). Every effort has been made to ensure that the contents have been compiled or derived from sources believed to be reliable and contain information and opinions that are accurate and complete. Information may be available to BMO Nesbitt Burns or its affiliates that is not reflected herein. However, neither the author nor BMO NBI makes any representation or warranty, express or implied, in respect thereof, takes any responsibility for any errors or omissions which may be contained herein or accepts any liability whatsoever for any loss arising from any use of or reliance on this report or its contents. This report is not to be construed as an offer to sell or a solicitation for or an offer to buy any securities. BMO NBI, its affiliates and/or their respective officers, directors or employees may from time to time acquire, hold or sell securities mentioned herein as principal or agent. NBI will buy from or sell to customers securities of issuers mentioned herein on a principal basis. BMO NBI, its affiliates, officers, directors or employees may have a long or short position in the securities discussed herein, related securities or in options, futures or other derivative instruments based thereon. BMO NBI or its affiliates may act as financial advisor and/or underwriter for the issuers mentioned herein and may receive remuneration for same. A significant lending relationship may exist between Bank of Montreal, or its affiliates, and certain of the issuers mentioned herein. BMO NBI is a wholly owned subsidiary of Bank of Montreal. Any U.S. person wishing to effect transactions in any security discussed herein should do so through BMO Nesbitt Burns Corp. Member-Canadian Investor Protection Fund.