April's Dip May Just Bounce Back
DHL Wealth Advisory - May 23, 2025
- Investment Services
- Portfolio Management
- Special Reports and Newsletters
- Total Client Experience
- Wealth Management
Despite having the first negative week in over a month, the S&P 500 has rebounded roughly 19% from its April 8 closing price...
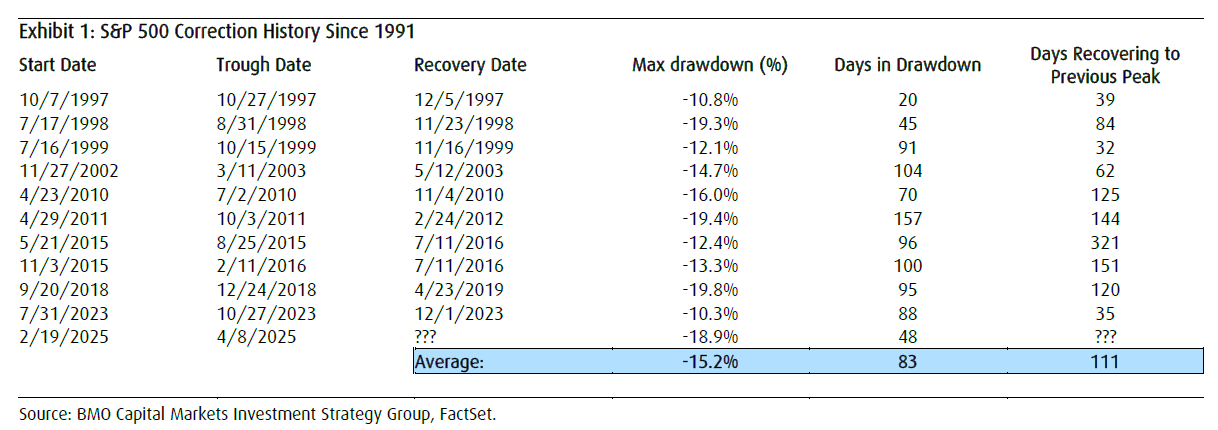
Despite having the first negative week in over a month, the S&P 500 has rebounded roughly 19% from its April 8 closing price. Investors have been vindicated in their view that the mid-February to early-April drawdown was a textbook correction rather than the onset of a bear market. Indeed, performance since that price low aligns more with a typical market correction rather than the start of a prolonged bear market. Historical data since 1991 reveals 11 similar instances where the index dropped more than 10% but managed to avoid crossing the 20% bear market threshold.

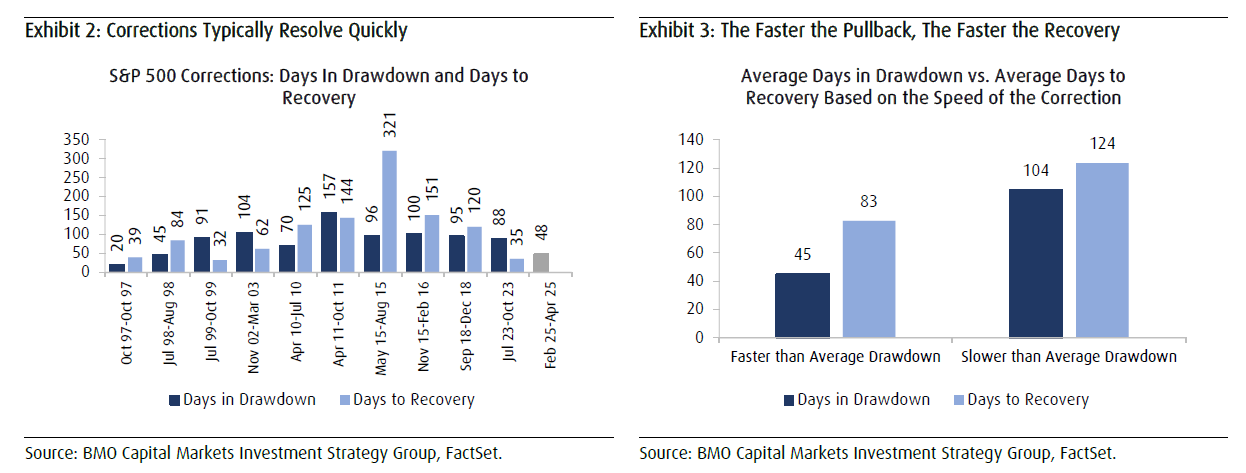
Among these pullbacks, the mildest decline was -10.3% (occurring between July and October 2023), while the steepest drop reached -19.8% (from September to December 2018). These pullbacks typically have materialized quickly, with the average time to trough at 83 days and recovery to prior peak taking 111 days. The current one bottomed in just 48 days which was much faster than average and suggests a quicker recovery may also be in store when compared to other faster-than-average drawdowns (Exhibits 2-3). Nonetheless, the most recent pullback ranks as the fourth-largest drawdown during this period at a peak-to-trough loss of 18.9% compared to the historical average of -15.2%.

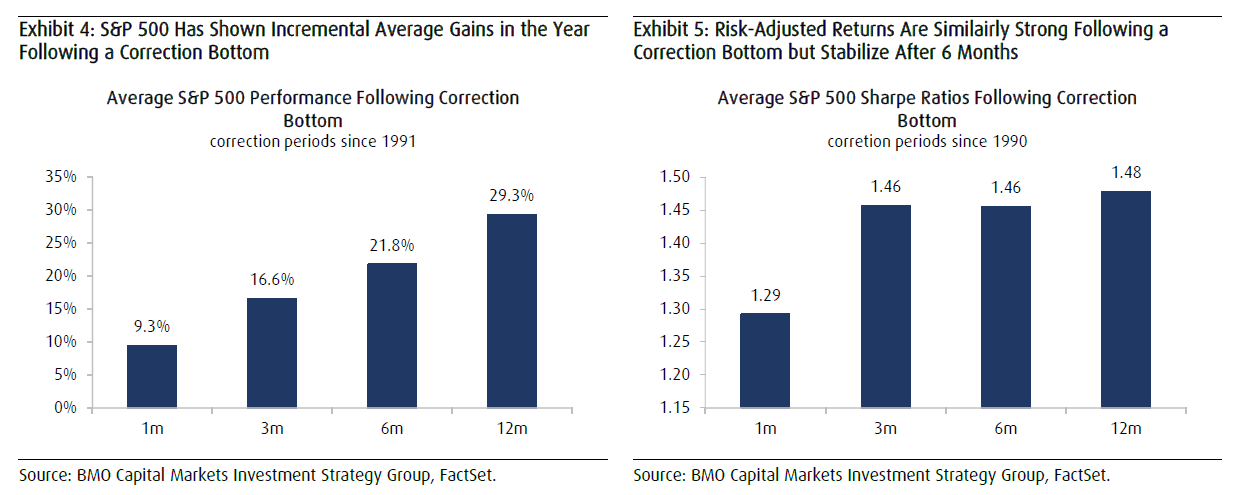
Market history suggests that the initial bounce off a correction low is rarely the end of the story, with gains often compounding well beyond the point of recovery to prior highs. Therefore, we believe that patient investors who remain allocated after the initial bounce continue to be rewarded by both strong returns and attractive risk-adjusted performance. For instance, a typical recovery takes a bit more than three months from a correction bottom, and S&P 500 gains are quite strong during that period posting average returns of 9.3% after one month and 16.6% after three months. But we also found that gains remain quite strong after the recovery period with the index posting average returns of 21.8% after six months and 29.3% one year after a correction bottom (Exhibit 4). In other words, the S&P 500 has exhibited incremental gains in each of the 1-, 3-, 6- and 12-month periods following a correction bottom. In addition, the risk-adjusted returns remain attractive at every stage, with Sharpe (risk-return ratios) ratios consistently above 1 and leveling off around 1.46 starting at the three-month mark (Exhibit 5)

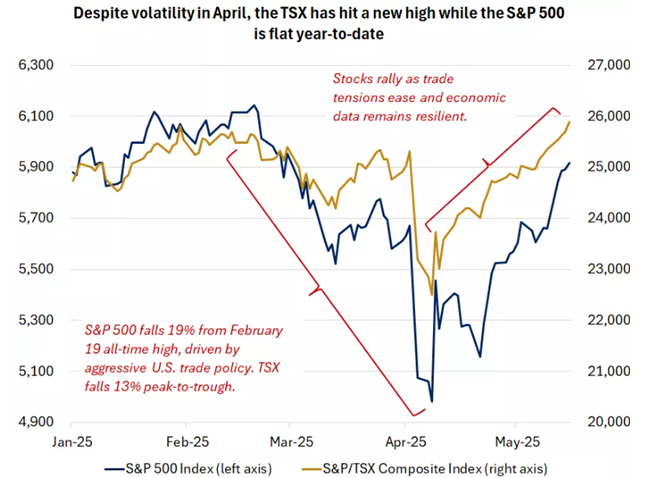
Stock markets, particularly within the U.S., have traveled quite the volatile path in a relatively short period of time. Globally diversified portfolios have travelled a smoother path this year, when compared with that of U.S. stocks, given the outperformance of bonds, Canadian stocks, and non-U.S. international stocks. Notably, Canadian large-cap stocks recorded a new all-time highs early this week. The market's recent performance demonstrates that by trying to avoid the worst days in the market, you could miss some of the best (something you frequently hear us say).
With tariffs likely remaining higher than the start of the year, markets will likely need to navigate a period of persistent inflation and softer economic growth. And with the U.S. 2017 Tax Cuts and Jobs Act expiring at year-end and the Trump administration having additional tax priorities, tax-policy conversations have begun in Washington, D.C. As policy conversations shift, periodic volatility should continue to be expected.
But the key for goal-oriented investors is to remain focused on what you can control. Set a well-diversified investment strategy based on your goals, using rebalancing strategies to help ensure your portfolio remains designed to deliver performance aligned with what you're trying to achieve as we navigate the uncertainties ahead. We recommend incorporating diversification across international and domestic markets; incorporating stocks of various sizes, styles and sectors; and adding fixed income, according to your personal goals and risk tolerances.

Source: FactSet, S&P500 Index, S&P/TSX Composite Index
Source: BMO Capital Markets US Strategy Comment: Factor Performance Trends Around Corrections
The opinions, estimates and projections contained herein are those of the author as of the date hereof and are subject to change without notice and may not reflect those of BMO Nesbitt Burns Inc. ("BMO NBI"). Every effort has been made to ensure that the contents have been compiled or derived from sources believed to be reliable and contain information and opinions that are accurate and complete. Information may be available to BMO Nesbitt Burns or its affiliates that is not reflected herein. However, neither the author nor BMO NBI makes any representation or warranty, express or implied, in respect thereof, takes any responsibility for any errors or omissions which may be contained herein or accepts any liability whatsoever for any loss arising from any use of or reliance on this report or its contents. This report is not to be construed as an offer to sell or a solicitation for or an offer to buy any securities. BMO NBI, its affiliates and/or their respective officers, directors or employees may from time to time acquire, hold or sell securities mentioned herein as principal or agent. NBI will buy from or sell to customers securities of issuers mentioned herein on a principal basis. BMO NBI, its affiliates, officers, directors or employees may have a long or short position in the securities discussed herein, related securities or in options, futures or other derivative instruments based thereon. BMO NBI or its affiliates may act as financial advisor and/or underwriter for the issuers mentioned herein and may receive remuneration for same. A significant lending relationship may exist between Bank of Montreal, or its affiliates, and certain of the issuers mentioned herein. BMO NBI is a wholly owned subsidiary of Bank of Montreal. Any U.S. person wishing to effect transactions in any security discussed herein should do so through BMO Nesbitt Burns Corp. Member-Canadian Investor Protection Fund.