He Said, Xe Said
DHL Wealth Advisory - Apr 25, 2025
Markets rallied in a big way this week as investors digested softening tariff rhetoric out of the US administration. While there was basically nothing on concrete progress, markets welcomed remarks from Donald Trump saying he is willing to take...
Markets rallied in a big way this week as investors digested softening tariff rhetoric out of the US administration. While there was basically nothing on concrete progress, markets welcomed remarks from Donald Trump saying he is willing to take a less confrontational approach toward trade talks with Beijing. Trump said on Friday that he has spoken with Chinese President Xi… Just not confirming when they spoke. China, on the other hand, has not confirmed any sort of dialogue. While it’s encouraging to hear a more dovish tone on tariffs from the administration, the ultimate goal for markets is either a reversal of the tariffs or significant trade deals.
Based on the daily news flow and our own client interactions, it seems that the pessimism among investors when it comes to the trajectory of US stocks, in particular, has increased substantially in recent weeks. While we understand that it has been a challenging market environment the past few months and the scope of the recent selloff has been unsettling, it is important to note that not all market indicators are signaling further downside in the months ahead, despite what some pundits may be suggesting. In fact, some contrarian indicators have recently plunged to excessively negative levels, which suggests that a bottoming process may well be on the horizon should history be any sort of guide. Therefore, as we have highlighted in recent reports, we believe it is important for investors to maintain their discipline and “stay the course” because the data continues to point to stronger prices compared to current levels for the upcoming year.
Main Points:
- Extremely Negative FY2 Earnings Revisions Have Been a Positive Market Signal
- The S&P 500 FY2 EPS Revision ratio has been a reliable contrarian indicator at extremely low levels with the index showing gains 80% of the time in the following year with an average return of 12.3%.
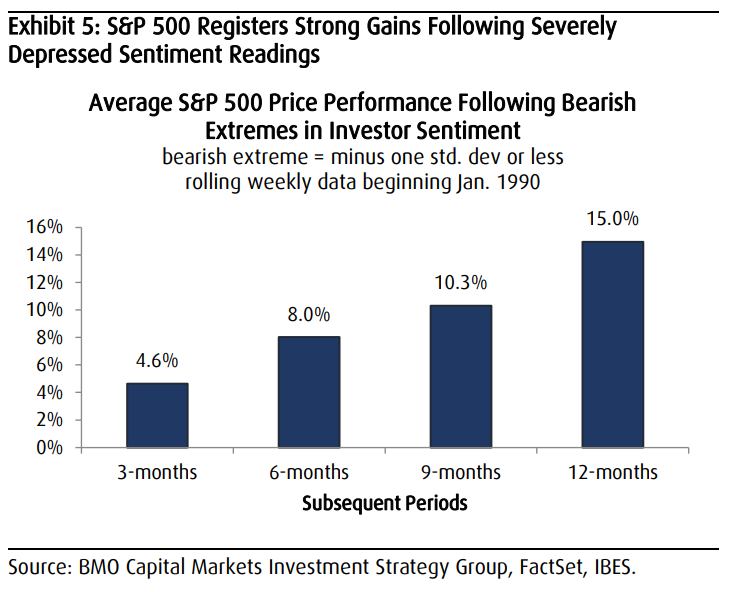
- Extremely Bearish Investor Sentiment Can Be a Positive for Future US Stock Market Performance
- One year after abnormal bearish sentiment readings, the S&P 500 has logged an average price return of 15% with double-digit gains occurring more than half of the time.

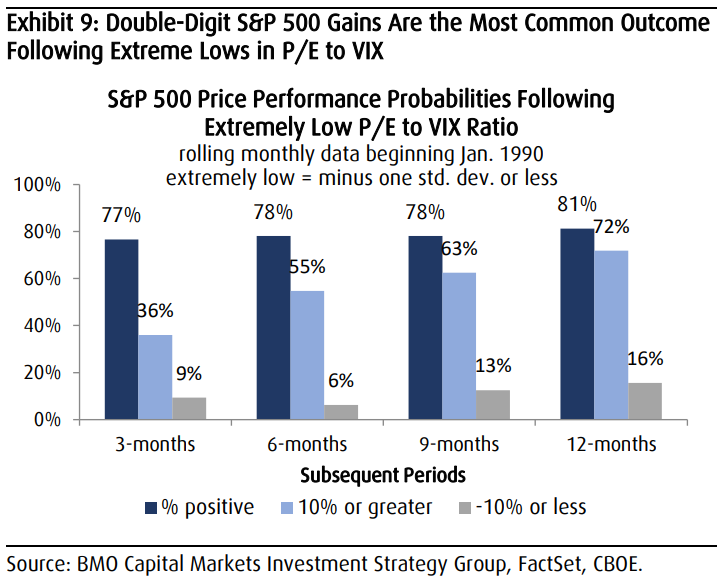
- Risk Aversion Has Quickly Become Excessive and Tends to Be Followed by Solid S&P 500 Gains
- Extremely low P/E to VIX ratios have typically been followed by strong market gains with US stocks rising 13.8%, on average, in the subsequent year with double-digit gains occurring nearly three quarters of the time.

- Should Latest Levels in These Indicators Prove to Be Longer-Term Trough Levels, Average Performance Is Even Better
- Average gains and probability of 10% or more returns jump following longer-term troughs in these indicators.
Elsewhere, Canadians are heading to the polling station on Monday. With the major parties releasing their official platforms just days before the April 28 election, we can only now fully dig into the costed plans. There are similarities, but there are still fundamental differences in fiscal priorities.
Prior to receiving the meaty details, it was widely assumed that federal finances were in a tough spot, given: 1) a soft starting point, 2) the dark trade cloud looming over the economic outlook, 3) new spending commitments related to defence and border security, and 4) the variety of (sometimes expensive) promises made by all parties during the campaign. Plus, the two leading parties have both scrapped the hike in the capital gains tax inclusion rate, at a cost of $3 billion per year on average over the next four years. Below, BMO’s Economic Research team focuses on what the two leading party platforms would imply for government finances and the economy (with details of the four largest parties’ platforms in the full the report should you wish a copy).
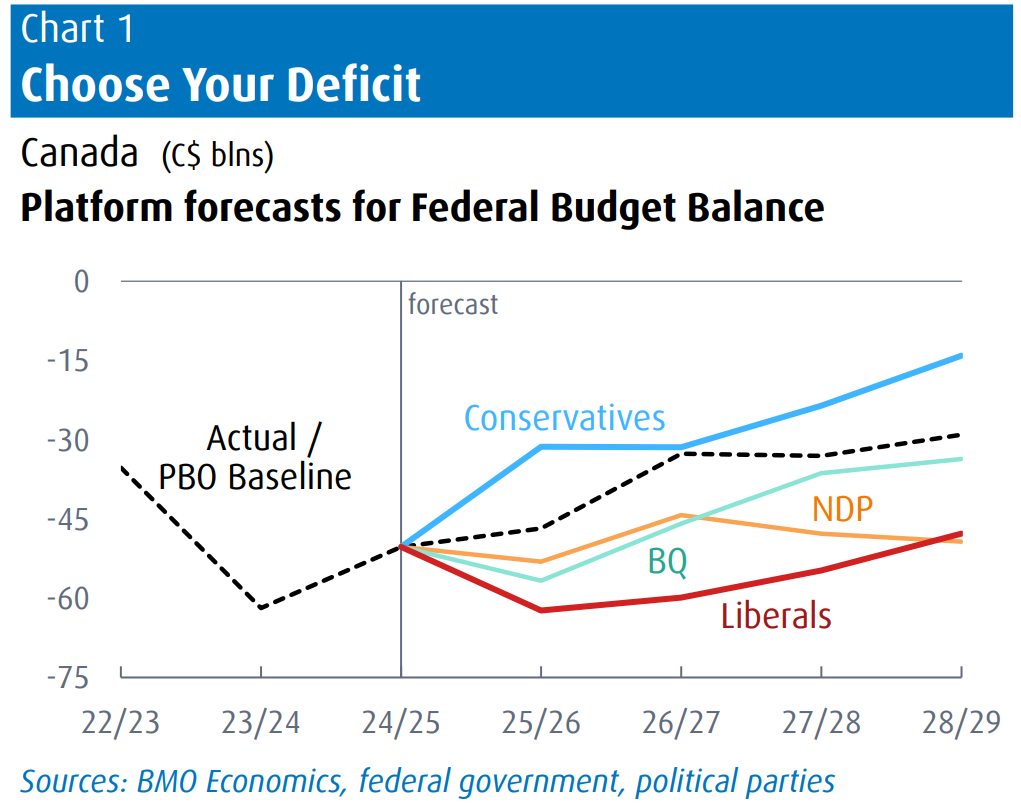
While there are many commonalities between the two major parties on the economic front—including the aforementioned reversal on capital gains, the end of the consumer carbon tax, and the removal of GST on new homes—there is a fundamental difference on the fiscal front. In a nutshell, the Liberals expect the budget deficit to widen this year and remain larger than the Parliamentary Budget Office (PBO) baseline assumptions over the next four years, while the Conservatives aim to reduce it versus PBO projections (Chart 1). The end result is that Ottawa’s debt/GDP ratio would be close to 43% by 2029 in the Liberal scenario versus just over 39% under the Conservative’s plan (both versus just over 40% with the PBO).

Of course, these projections must be viewed through the lens of them being political documents, and the forecasts can be seen as more aspirational than likely outcomes. Afterall, politics is the art of looking for trouble, finding it everywhere, diagnosing it incorrectly and applying the wrong medicines… But we digress. The projections do highlight priorities, and the key difference is that the Liberals are leaning to more spending/investment, while the Conservatives are more focused on containing the deficit alongside slightly more tax relief. But what is truly striking from the projections is that even the Conservatives are no longer aiming to balance the budget in the forecast horizon, while the Liberals have essentially fully cut loose the last of the fiscal anchors with the debt/GDP ratio creeping up in their projections. Both of these reflect the new reality of a more challenging economic and fiscal backdrop versus even just six months ago. And, tellingly, these forecasts are based on the assumption of decent economic growth —1.7% for GDP this year.
It’s fair to say that both parties employ optimistic assumptions to hit their goals, with the Liberals counting on substantial unspecified spending savings and the Conservatives relying on strong growth multipliers from various measures (and baking in potential revenue gains from the expected boost to growth). Naturally, no one will be surprised if (when) in both cases, deficits would be larger than projected if the parties carry through with the many election promises. Moreover, there is the overriding risk to both plans that the economy could easily turn out to be much softer than baseline projections, especially in light of the deep U.S. policy uncertainty, both on the trade front, and now even for monetary policy. Here are some key points from each of the two major platforms.
Liberal Platform
- On the tax side, the main measure is a 1 ppt reduction in the lowest income tax bracket, and removing the GST on new homes for first-time buyers.
- On the spending side, some of the big-ticket items include a $2 billion Strategic Response Fund to support industries, and $2 billion in direct support for workers and businesses during the trade war.
- Large outlays for infrastructure (transportation and trade-related).
- Ambitious housing policy to spur new building, including a government Build Canada Homes agency.
- Defence spending to exceed 2% NATO target by 2030 (vs 1.3% recently).
Conservative Platform
- On taxes, lower the lowest rate by 2.25 ppts in three phases.
- A $5,000 top-up in TSFAs for funds invested in Canada. Deferral of capital gains tax if reinvested in Canada. Delay in RRIF requirements by two years to age 73.
- Remove the GST on Canadian-made autos, and on all new homes under $1.3 million. Remove the carbon tax on large industrial emitters.
- On the spending side, funding to support jobs affected by U.S. tariffs. Deep reductions in government spending on consultants, and on foreign aid.
- Defence spending of 2% of GDP by 2030.
- Streamline and speed up approval process of resource development, remove emissions cap on oil & gas, support East-West pipeline.
Net Fiscal Impact
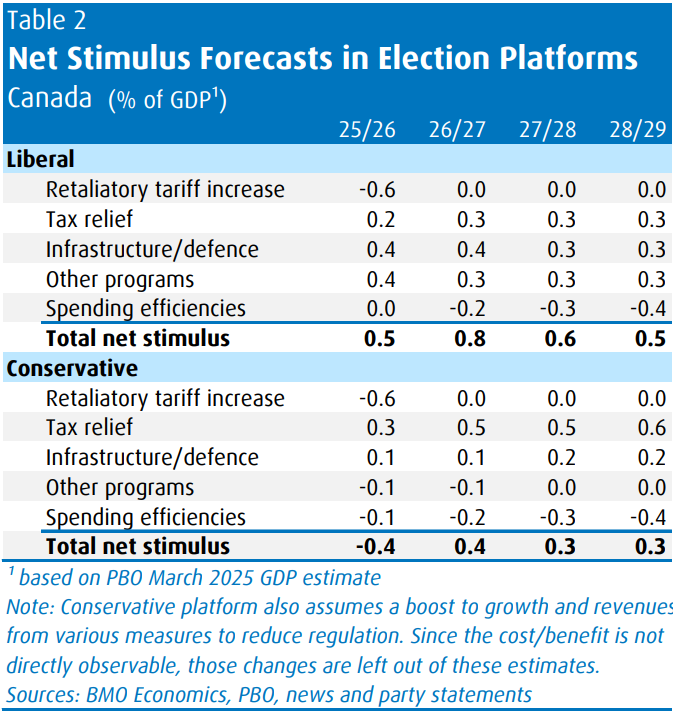
Sifting through the various measures, BMO’s Economics team has attempted to suss out the net new spending and tax measures, and how much they may drive growth. Table 2 is their best estimate based on available information, and it suggests that the biggest gap in policy will land in the current year. With both parties expecting Canada’s retaliatory tariffs to raise $20 billion (or 0.6% of GDP) - which can be thought of as a tax increase - the net new stimulus under the Liberals is +0.5% of GDP in FY25/26, versus net restraint of 0.4% under the Conservatives. The Liberals are projecting new spending of 0.8% of GDP and tax relief of 0.2% this year (total support of just over 1% of GDP before the tariff revenue), while the Conservatives are projecting tax relief of 0.3% of GDP, but spending reductions of 0.1% of GDP (total support of 0.2% of GDP before tariffs). That summarizes the key distinction in priorities for this fiscal year, but the difference in overall support narrows substantially in the out years—with the Conservatives planning somewhat higher tax relief in coming years, while the Liberals will boost spending further.
Bottom Line: While many have highlighted some of the similarities in the proposals by the two leading parties, there are still fundamental differences in priorities. Given the political nature of the official platforms and the deep uncertainty surrounding the economic outlook, we would recommend that the fiscal projections be taken seriously, but not literally. The Liberals plan on being much more activist in supporting the economy through spending on infrastructure, housing and other programs, at the cost of a higher budget deficit. The Conservatives are more focused on controlling the deficit through spending restraint, while leaning more toward lower taxes and reduced regulation, but with less direct support for the economy and housing. Yes, they have some similar policy proposals, but the lines are thus fairly clearly drawn on the fiscal priorities.

Sources: US Strategy Comment: Some Reasons for Optimism Amid All the Negativity, BMO Economics Special Report: Canadian Election 2025: The Economics
The opinions, estimates and projections contained herein are those of the author as of the date hereof and are subject to change without notice and may not reflect those of BMO Nesbitt Burns Inc. ("BMO NBI"). Every effort has been made to ensure that the contents have been compiled or derived from sources believed to be reliable and contain information and opinions that are accurate and complete. Information may be available to BMO Nesbitt Burns or its affiliates that is not reflected herein. However, neither the author nor BMO NBI makes any representation or warranty, express or implied, in respect thereof, takes any responsibility for any errors or omissions which may be contained herein or accepts any liability whatsoever for any loss arising from any use of or reliance on this report or its contents. This report is not to be construed as an offer to sell or a solicitation for or an offer to buy any securities. BMO NBI, its affiliates and/or their respective officers, directors or employees may from time to time acquire, hold or sell securities mentioned herein as principal or agent. NBI will buy from or sell to customers securities of issuers mentioned herein on a principal basis. BMO NBI, its affiliates, officers, directors or employees may have a long or short position in the securities discussed herein, related securities or in options, futures or other derivative instruments based thereon. BMO NBI or its affiliates may act as financial advisor and/or underwriter for the issuers mentioned herein and may receive remuneration for same. A significant lending relationship may exist between Bank of Montreal, or its affiliates, and certain of the issuers mentioned herein. BMO NBI is a wholly owned subsidiary of Bank of Montreal. Any U.S. person wishing to effect transactions in any security discussed herein should do so through BMO Nesbitt Burns Corp. Member-Canadian Investor Protection Fund.