150 Years of Data Says...
DHL Wealth Advisory - Mar 07, 2025
- Investment Services
- Portfolio Management
- Special Reports and Newsletters
- Total Client Experience
- Wealth Management
Here we go again. Again, sorta. U.S. President Trump’s executive order imposing a 25% tariff on all non-energy imports from Canada and a 10% tariff on energy imports is now, somewhat, effective...
Here we go again. Again, sorta. U.S. President Trump’s executive order imposing a 25% tariff on all non-energy imports from Canada and a 10% tariff on energy imports is now, somewhat, effective. Separately, a 25% tariff was levied on all imports from Mexico and an additional 10% tariff was put on all imports from China. These rates are in addition to any tariffs or duties already charged.
The President invoked the International Emergency Economic Powers Act (IEEPA) to apply these tariffs. After declaring a national emergency at the southern border due to “the influx of illegal aliens and illicit drugs”, the President expanded this to cover “the public health crisis of deaths due to the use of fentanyl and other illicit drugs”. And, specifically, “the failure of Canada to do more to arrest, seize, detain, or otherwise intercept DTOs [drug trafficking organizations], other drug and human traffickers, criminals at large, and drugs”. However, in the last few days we have learned that auto plants have been exempted for another 30 days, along with everything within the Trump negotiated USMCA agreement (NAFTA 2.0). That comprises ~40% of Canadian/US Trade and 50% of Mexico/US Trade.
There’s so much back and forth uncertainty around this that it really is something to shake ones head at. There are literally hundreds of billions of dollar of goods being threated rather flippantly by the US administration that it seems more like a game then real macro policy. Think of US farmers for instance when Trump tells them to have “fun”. Eighty of their fertilizer comes from Canada, the machinery they use is made from Canadian steel, there are goods they make that are produced in excess of what the local markets can consume, so they sell it to…guess who, Canadians. There’s nothing “fun” about all of this. US farmers are faced with rising costs and a lot of uncertainty. That’s our rant for today…
In any event, the implications for markets will be volatility. We have been writing for months now that 2025 was always going to be a more volatile year, regardless of who sat in the White House. We have had two successive years where the markets have more or less just gone higher. That’s not totally normal. While our fundamentally constructive outlook on the market for 2025 remains in place, there are most definitely going to be more pronounced swings than what we saw in 2023-2024.
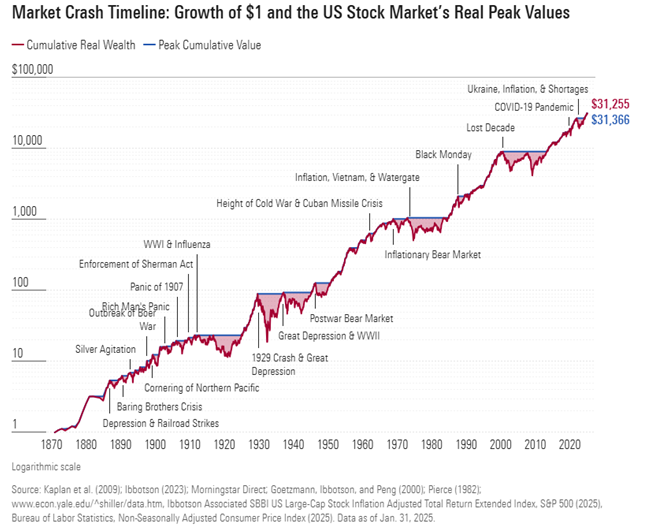
In periods of heightened volatility and uncertainty, we always find it helpful to revisit market history. Here, we turn to data that Paul Kaplan compiled for the book Insights into the Global Financial Crisis. Kaplan’s data includes monthly US stock market returns going back to January 1886 and annual returns over the period from 1871-1885. In the chart below, each bear-market episode is indicated with a horizontal line, which starts at the episode’s peak cumulative value and ends when the cumulative value recovers to the previous peak. (Note that we use the term “market crash” interchangeably with bear market, which is generally defined as a decline of 20% or more.)

When you incorporate the effect of inflation, one dollar (in 1870 US dollars) invested in a hypothetical US stock market index in 1871 would have grown to $31,255 by the end of January 2025. The substantial growth of that $1 highlights the enormous benefits of staying invested for the long term. Still, it was far from a steady increase over that period. There were 19 market crashes along the way, with varying levels of severity. Some of the most severe market crashes have included:
- The Great Depression, which began with the crash of 1929. This 79% stock market loss was the worst drop of the past 150 years.
- The Lost Decade, which included both the dot-com bubble burst, 9/11, and the Great Recession. Though the market began recovering after the dot-com bubble burst, it didn’t climb back to its previous level before the crash of 2007-09. It didn’t reach that level until May 2013—more than 12 years after the initial crash. This period, the second-worst drop of the past 150 years, ultimately included a stock market loss of 54%.
- Inflation, Vietnam, and Watergate, which began in early 1973 and ultimately led to a stock market decline of 51.9%. Factors that contributed to this bear market include civil unrest related to the war in Vietnam and the Watergate scandal, in addition to high inflation from the OPEC oil embargo. This market downturn is particularly relevant to today’s environment, given issues like the recent inflation surge and the Russia-Ukraine and Israel-Hamas wars.
These examples demonstrate the frequency of market crashes. Though these events are significant at the moment, they are indeed regularly occurring events that happen approximately once a decade. So, what does this history tell us about navigating volatile markets? Mainly, that they’re worth navigating.
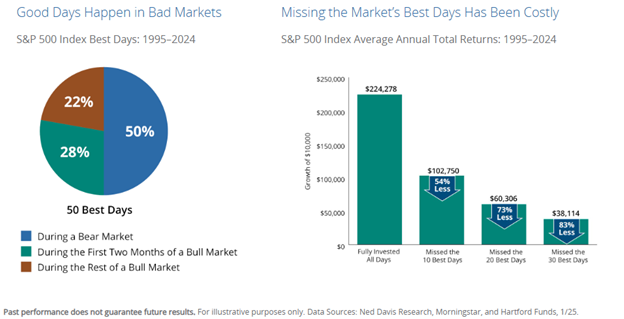
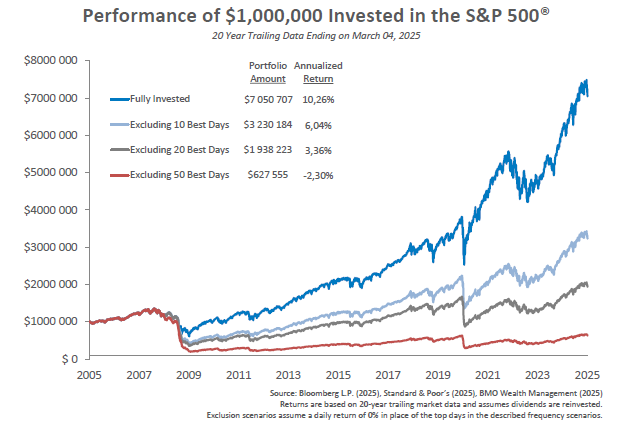
The reason? Avoiding the market’s downs may mean missing out on the ups as well. Seventy-eight percent of the stock market’s best days have occurred during a bear market or during the first two months of a bull market. If you missed the market’s 10 best days over the past 30 years, your returns would have been cut in half. And missing the best 30 days would have reduced your returns by an astonishing 83%. This is the real risk of going to cash and trying to time markets.


Just think of February and March in 2020 when it seemed like our way of life had permanently changed. After a couple stressful months in the first half of 2020, the markets recovered—just as they did after a 79% decline in the early 1930s. And that’s the point: Market crashes always feel scary when they happen, but there’s no way to know in the moment if you’re encountering a minor correction or looking down the barrel of the next Great Depression.
Still, even if you are looking down the barrel of the next Great Depression, history shows us that the market eventually recovers. But since the path to recovery is so uncertain, the best way to be prepared is by owning a well-diversified portfolio that fits your time horizon and risk tolerance. Investors who stay invested in the market in the long run will reap rewards that make the turmoil worthwhile. So what have we learned from a 150 years of market crashes? Though they varied in length and severity, the market always recovered and went on to new highs.
Far more money has been lost by investors preparing for corrections, or trying to anticipate corrections, than has been lost in corrections themselves.
- Wall Street legend, Peter Lynch.
The opinions, estimates and projections contained herein are those of the author as of the date hereof and are subject to change without notice and may not reflect those of BMO Nesbitt Burns Inc. ("BMO NBI"). Every effort has been made to ensure that the contents have been compiled or derived from sources believed to be reliable and contain information and opinions that are accurate and complete. Information may be available to BMO Nesbitt Burns or its affiliates that is not reflected herein. However, neither the author nor BMO NBI makes any representation or warranty, express or implied, in respect thereof, takes any responsibility for any errors or omissions which may be contained herein or accepts any liability whatsoever for any loss arising from any use of or reliance on this report or its contents. This report is not to be construed as an offer to sell or a solicitation for or an offer to buy any securities. BMO NBI, its affiliates and/or their respective officers, directors or employees may from time to time acquire, hold or sell securities mentioned herein as principal or agent. NBI will buy from or sell to customers securities of issuers mentioned herein on a principal basis. BMO NBI, its affiliates, officers, directors or employees may have a long or short position in the securities discussed herein, related securities or in options, futures or other derivative instruments based thereon. BMO NBI or its affiliates may act as financial advisor and/or underwriter for the issuers mentioned herein and may receive remuneration for same. A significant lending relationship may exist between Bank of Montreal, or its affiliates, and certain of the issuers mentioned herein. BMO NBI is a wholly owned subsidiary of Bank of Montreal. Any U.S. person wishing to effect transactions in any security discussed herein should do so through BMO Nesbitt Burns Corp. Member-Canadian Investor Protection Fund.