It’s a Small (Rate) World, After All
DHL Wealth Advisory - Oct 04, 2024
This last two weeks have seen a global response to the aggressive 50 basis point cut out of the US Federal Reserve. The big step by the world’s most important central bank has taken the shackles off policymakers almost everywhere...
This last two weeks have seen a global response to the aggressive 50 basis point cut out of the US Federal Reserve. The big step by the world’s most important central bank has taken the shackles off policymakers almost everywhere. China got the ball really rolling with a series of long-awaited stimulus measures, including 20-30 bp interest rate cuts and a drop in reserve requirements. Sweden, Switzerland, and Mexico cut rates by 25 bps, all three for the third time this cycle. Just a few short weeks ago, we crowed that the Bank of Canada was leading the world with 3 cuts of 25 bps—well, the world just caught up.
We salute the Federal Reserve for being bold and cutting interest rates by 0.5%. To us, this is a clear signal that the most important bank in the world is serious about engineering a so-called “soft landing” where the economy avoids a recession. If this is achieved the implications for the stock market will be profound. Simply put, recessions are never good news for risky assets such as equities and high-yield bonds but can, conversely, create increased demand for safer government bonds.
Source: Investment Strategy: Rate Cuts and the Yield Curve Steepening – A Good Omen for 2024/2025
We recently wrote about markets typically posting strong gains during easing cycles. In fact, based on data going back to 1928 (encompassing an impressive 22 Fed rate cut cycles), mean U.S. market returns turned positive almost immediately following the first Fed rate cut, with 20% average annualized total returns 12 months after the first rate cut. This represents more than 10% better performance vs. the market’s historical return (i.e., including non-easing cycles). Top sectors included Consumer Staples and Discretionary, Healthcare, and Tech. Of course, every cycle is different and contains idiosyncratic drivers. Still, the results make intuitive sense since a lower cost of funds helps consumers and corporations.
Source: Investment Strategy: Rate Cuts and the Yield Curve Steepening – A Good Omen for 2024/2025
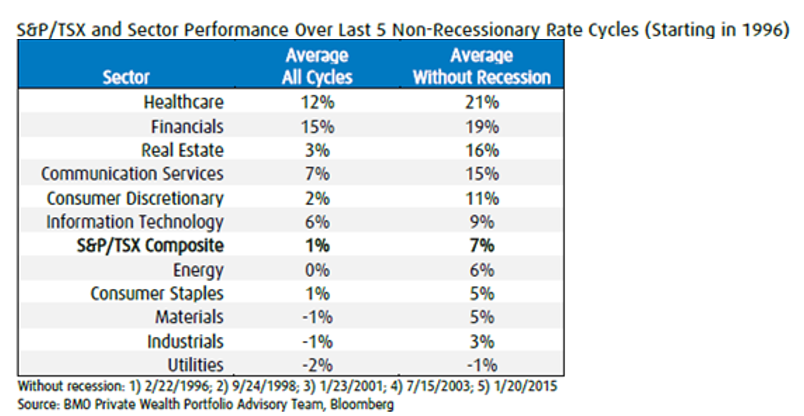
With the Bank of Canada (“BoC”) leading the charge with 3 rate cuts already, we also wanted to include Canadian figures (with cycles starting in 1996). While the dataset is far more limited than in the U.S., results were also positive when an easing cycle was not accompanied by a recession (again our base case). As shown by the table below, the broader index posts modest 7% returns, on average. Among large sectors, top performers include Financials, Real Estate and Consumer Discretionary. We just happen to have strong conviction exposure and ideas for all these sectors (reach out to us if you want to hear more!).
Source: Investment Strategy: Rate Cuts and the Yield Curve Steepening – A Good Omen for 2024/2025

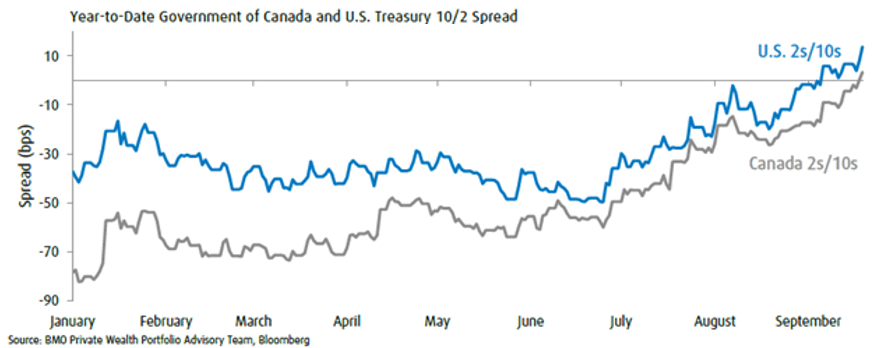
There has also been a lot of talk in recent weeks on the steepening of the “yield curve”. Now, this can get very technical, so we’ll try our best to keep this high level. The yield curve is the slope of Government Treasuries and generally the spread between the 2 and 10-year notes. In a normal functioning economic backdrop, the yield curve is upward slopping with short term interest rates lower than long-term rates. The extra risk-reward premium for putting money to work on a longer dated asset (That’s our Econ101 lesson of the month).
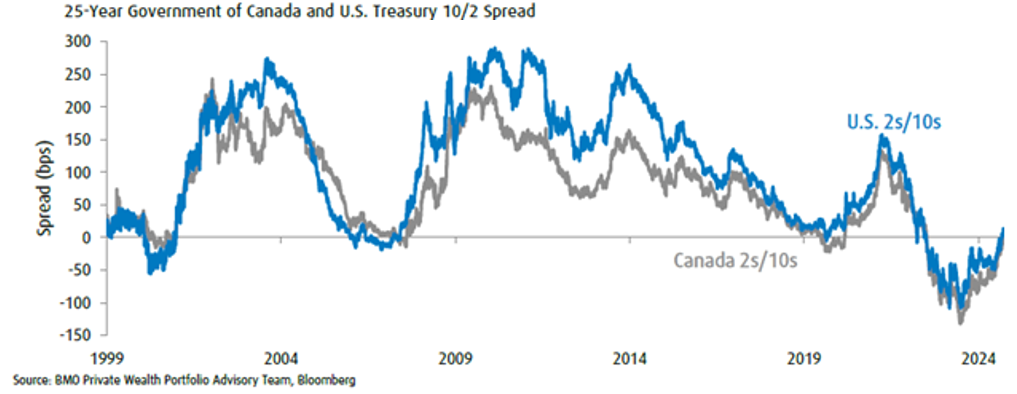
The charts below show just how much steeper the curves in Canada and the U.S. have gotten year-to-date (a positive number on the left axis shows how much higher 10-year rates are vs. 2-year rates). We also include a longer-term chart for perspective.
Source: Investment Strategy: Rate Cuts and the Yield Curve Steepening – A Good Omen for 2024/2025


This is good news since the market historically tends to perform well when the curve is steepening. The reason for this is that this structure has long been seen as a harbinger of future economic strength. From that perspective, the inverted yield curve (when short-term interest rates are higher than longer-term rates) we experienced since mid-2022 caused investor anxiety since it has often been a 12-to-24-month leading indicator of recessions in the last fifty years. There have also been exceptions to this rule, however. We think the current cycle could be one of those times given the remarkable resilience of the labour market (as evident by the blockbuster US jobs report this morning), corporate spending and, more importantly, the fact that inflation trends have vastly improved in North America and globally.
Source: Investment Strategy: Rate Cuts and the Yield Curve Steepening – A Good Omen for 2024/2025
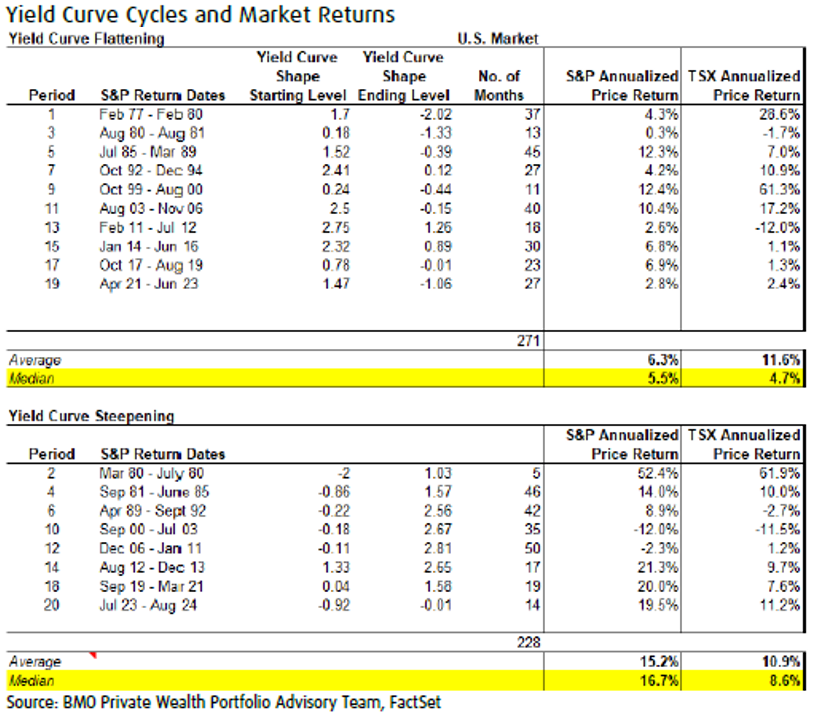
Going back to the late 1970s, the S&P 500 and S&P/TSX have done better during cycles when the yield curve was steepening with average median annualized price returns of 16.6% and 8.6% respectively vs. 5.5% and 4.7% when the yield curve was flattening.
Source: Investment Strategy: Rate Cuts and the Yield Curve Steepening – A Good Omen for 2024/2025

Of course we cannot ignore that economic risks remain especially considering the heightened geo-political risks, the upcoming U.S. election and the potential for a Canadian election to be called in the near term that could potentially change the political landscape. This time however, unlike previous years, bonds can play an important role in investment portfolios as they continue to offer attractive yields and offer some downside protection against weaker risk asset markets. Assuming a soft landing scenario, we expect short- to mid-term yields to continue to be well supported especially if inflation continues trending closer to its target, which could lead yields lower in the near term. In fact, we added some additional fixed income exposure to our discretionary portfolios this week.
Source: Investment Strategy: Rate Cuts and the Yield Curve Steepening – A Good Omen for 2024/2025
The opinions, estimates and projections contained herein are those of the author as of the date hereof and are subject to change without notice and may not reflect those of BMO Nesbitt Burns Inc. ("BMO NBI"). Every effort has been made to ensure that the contents have been compiled or derived from sources believed to be reliable and contain information and opinions that are accurate and complete. Information may be available to BMO Nesbitt Burns or its affiliates that is not reflected herein. However, neither the author nor BMO NBI makes any representation or warranty, express or implied, in respect thereof, takes any responsibility for any errors or omissions which may be contained herein or accepts any liability whatsoever for any loss arising from any use of or reliance on this report or its contents. This report is not to be construed as an offer to sell or a solicitation for or an offer to buy any securities. BMO NBI, its affiliates and/or their respective officers, directors or employees may from time to time acquire, hold or sell securities mentioned herein as principal or agent. NBI will buy from or sell to customers securities of issuers mentioned herein on a principal basis. BMO NBI, its affiliates, officers, directors or employees may have a long or short position in the securities discussed herein, related securities or in options, futures or other derivative instruments based thereon. BMO NBI or its affiliates may act as financial advisor and/or underwriter for the issuers mentioned herein and may receive remuneration for same. A significant lending relationship may exist between Bank of Montreal, or its affiliates, and certain of the issuers mentioned herein. BMO NBI is a wholly owned subsidiary of Bank of Montreal. Any U.S. person wishing to effect transactions in any security discussed herein should do so through BMO Nesbitt Burns Corp. Member-Canadian Investor Protection Fund.