Q: How Long Does the Average Bull Market Last? A: Longer Than You Think.
DHL Wealth Advisory - Sep 06, 2024
Global markets wasted little time living up to the dreaded worst month of the year moniker with the S&P 500 dropping 2.1% on the first trading day of September, its worst daily performance since early August...
Global markets wasted little time living up to the dreaded worst month of the year moniker with the S&P 500 dropping 2.1% on the first trading day of September, its worst daily performance since early August and only the third daily drop of 2% or more this year. The rest of the week didn’t go much better with a few benchmarks dropping ~5%. To be clear, we never like when investors lose money, but at the same time we are not totally surprised by the latest weakness given the lack of a meaningful pullback YTD.
Source: US Strategy Comment: September Enters Like a Lion
Remember, the S&P 500 has averaged about one technical correction (i.e., -10%) during the calendar year for the past several decades; however, the so-called July through August market meltdown still felt short of this designation with the index shedding roughly 8.5% during that time. Nonetheless, we remain optimistic for the rest of the year since history suggests that year-to-date gains of this magnitude tend to lead to further gains through year-end. In addition, the market has clearly been in a bull market for the past two years and except for the pandemic rebound all bull markets over the past 50 years have made it to a third year with an average length of roughly six years. In other words, we continue to view periods of weakness as dip buying opportunities.
Source: US Strategy Comment: September Enters Like a Lion
Main Points:
- September Weakness Not Necessarily a Harbinger for Rest of Year
- The magnitude of 2024 YTD gains suggests further gains are likely through year-end.
- However, additional pullbacks have been common during the last four months for years where first eight-month gains have been similarly strong.
- This Remains a Bull Market Suggesting Further Gains
- It is rare for a bull market to not enter a third year with bull markets lasting an average of roughly six years for the past 50 years
Source: US Strategy Comment: September Enters Like a Lion
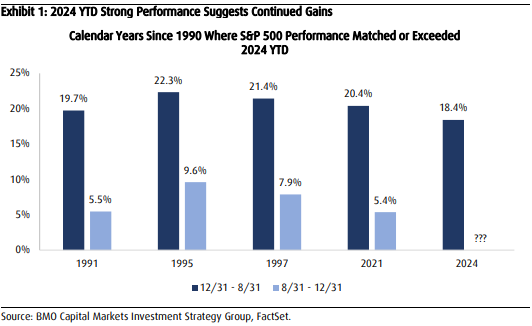
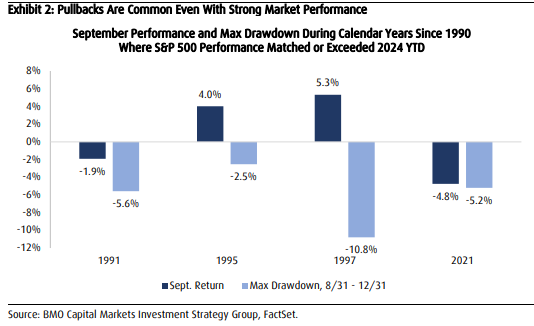
Notwithstanding September’s sluggish start, market performance has been extremely impressive so far in 2024 as the S&P 500 gained 18.4% during the first eight months of the year, which puts it in the 85th percentile for all years from 1950. In fact, there have been only four other years with stronger performance since 1990, and the S&P 500 produced further gains through year-end in each of those years (Exhibit 1). In addition, September market performance was negative during two of those years (1991 -1.9% and 2021 -4.8%) and all but three years saw an additional drawdown of 5% or more from September and on (Exhibit 2)
Source: US Strategy Comment: September Enters Like a Lion
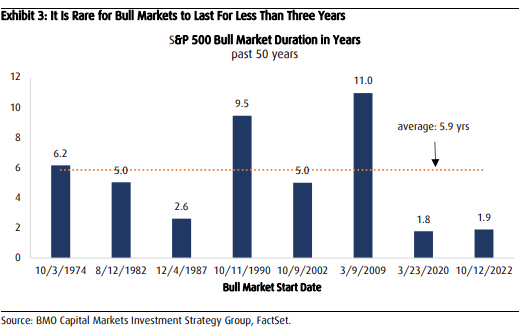
While it is impossible to know exactly how long this bull market will last, we can look at history to give us some guidance. After all, while history doesn’t repeat, it often rhymes. The average S&P 500 bull market over the past 50 years has lasted an average of roughly six years, with the longest being 11 years (3/9/2009 - 2/19/2020) and the shortest being 1.9 years (3/23/20 – 1/3/22) (Exhibit 3). In fact, all bull markets except for the pandemic rebound made it to a third year, suggesting there is plenty of room for stocks to run from current levels considering the market has yet to hit its two-year mark (which would be 10/12).
Source: US Strategy Comment: September Enters Like a Lion
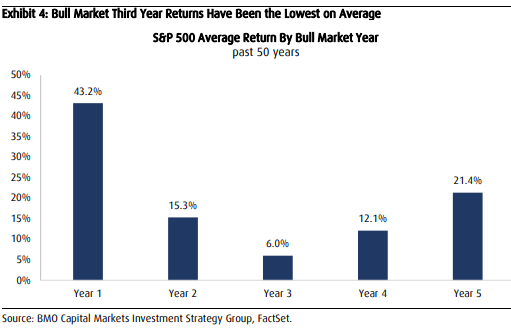
However, it is also worth noting that even despite our continued optimism, historical data shows that the third year of bull markets has produced the lowest returns (Exhibit 4), suggesting to us that the market is likely headed to a more “normal” return structure in the coming months and beyond. As much as we would welcome it, 20% gains are not a normal market occurrence…
Source: US Strategy Comment: September Enters Like a Lion
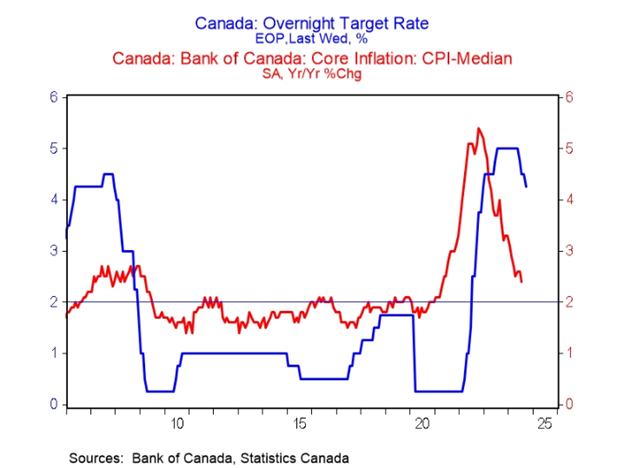
Meanwhile, the Bank of Canada cut its overnight target rate again by 25 bps to 4.25% on Wednesday, as widely expected. This marks the third cut in three consecutive meetings, and leaves the BoC as the top cutter among G10 central banks so far this cycle. With the rate decision itself of little surprise, the focus was mostly on the tone of the Statement, and while it was mostly bland and factual, there were a few dovish morsels.
Source BMO Economics EconoFACTS: BoC Policy Announcement
Bottom Line: We expect the Bank to continue grinding down rates in coming meetings, and, while we anticipate a series of 25 bp steps into early next year, we certainly will not rule out a possible 50 bp step at some point. That's especially true if inflation behaves and/or the unemployment rate takes another big step up. And the reality is that the jobless figures have quickly become equally as important as the inflation data in the Bank's decision making. For now, expectations are for the Bank to cut rates to 3.5% by January, and then to 3.0% by next June, but the risks tilt to the Bank going faster than that, and potentially further.
Source BMO Economics EconoFACTS: BoC Policy Announcement
The opinions, estimates and projections contained herein are those of the author as of the date hereof and are subject to change without notice and may not reflect those of BMO Nesbitt Burns Inc. ("BMO NBI"). Every effort has been made to ensure that the contents have been compiled or derived from sources believed to be reliable and contain information and opinions that are accurate and complete. Information may be available to BMO Nesbitt Burns or its affiliates that is not reflected herein. However, neither the author nor BMO NBI makes any representation or warranty, express or implied, in respect thereof, takes any responsibility for any errors or omissions which may be contained herein or accepts any liability whatsoever for any loss arising from any use of or reliance on this report or its contents. This report is not to be construed as an offer to sell or a solicitation for or an offer to buy any securities. BMO NBI, its affiliates and/or their respective officers, directors or employees may from time to time acquire, hold or sell securities mentioned herein as principal or agent. NBI will buy from or sell to customers securities of issuers mentioned herein on a principal basis. BMO NBI, its affiliates, officers, directors or employees may have a long or short position in the securities discussed herein, related securities or in options, futures or other derivative instruments based thereon. BMO NBI or its affiliates may act as financial advisor and/or underwriter for the issuers mentioned herein and may receive remuneration for same. A significant lending relationship may exist between Bank of Montreal, or its affiliates, and certain of the issuers mentioned herein. BMO NBI is a wholly owned subsidiary of Bank of Montreal. Any U.S. person wishing to effect transactions in any security discussed herein should do so through BMO Nesbitt Burns Corp. Member-Canadian Investor Protection Fund.