Race To the Bottom, And We Are Not Talking About the Canucks.
DHL Wealth Advisory - Mar 01, 2024
Another week. Another week of record gains for most major North American benchmarks. The S&P 500 has rallied sharply in recent days on the heels of some extremely impressive earnings results from several high-profile names and is now sitting...
Another week. Another week of record gains for most major North American benchmarks. The S&P 500 has rallied sharply in recent days on the heels of some extremely impressive earnings results from several high-profile names and is now sitting comfortably above the 5,100 mark just weeks after breaking through the 5,000 level for the first time ever. Obviously, we are starting to receive client questions regarding market froth and year-end targets especially since several market pundits are now increasing 2024 targets.
Source: US Strategy Comment: S&P 500 Target Update, Holding Steady
Taking a step back from the trees to look at the forest, the major message from the recent round of economic data globally is that growth is still chugging along while inflation continues to walk down a jagged path toward normalcy. And, together, that’s a good thing. At least to this point, it appears that the massive rate hikes of the past two years have struck just the right balance by chilling growth enough to undercut the most extreme inflation pressures, without tipping the economy into an outright downturn. Of course, even mentioning this has the feel of discussing a no-hitter with the pitcher in, say, the seventh inning—that is, just before the job is finished, with the risk of jinxing it all. Markets have no fear of jinxes, and are eagerly pricing in a soft landing.
Source: BMO Economics Talking Points: March-ing to a Different Drummer
In the U.S., some may quibble that the meaty 0.4% rise in the core PCE deflator in January hardly seems like inflation progress. But the bigger picture is that the annual trend has moderated to its slowest pace since March 2021 at 2.8%—half the peak two years earlier—and the six-month trend is an acceptable 2.5. Friendly base effects suggest that the yearly pace could easily take a few more steps down over the next three months. Other core metrics are a bit higher, but also moderated in January, to 3.2% for the Dallas Fed’s trimmed mean, and 3.5% for the Cleveland Fed’s median PCE. These measures are broadly comparable to the Bank of Canada’s core metrics, and send the message that there is a bit more work to do.
Source: BMO Economics Talking Points: March-ing to a Different Drummer
The biggest risk to the soft landing scenario in the U.S. appears to be that there will be no landing at all, with voices growing that rate cuts may be even further delayed (perhaps beyond our call of a July start). This week’s slate of figures was mixed, with a generally softer tinge, but not indicative of an economy rolling over.
Source: BMO Economics Talking Points: March-ing to a Different Drummer
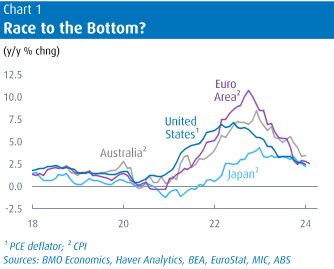
A wide variety of other major economies also reported a gradual descent in inflation trends, even as growth stayed on course. The Euro Area, often first out of the gate on monthly CPI, reported headline inflation eased two ticks to 2.6% y/y in February, and to 3.1% for core. While both were a bit above consensus, note the very ‘normal’ feel to those figures, as opposed to the grotesque 5, 6, or even 10% readings from 2022. Similarly, Japan’s headline inflation has been cut in half to 2.2%, from the four-decade peak of 4.3% in 2022. Just take at look at the following chart illustrating the dramatic pull-back in global inflationary figures.
Source: BMO Economics Talking Points: March-ing to a Different Drummer

Meanwhile, this week we learned that solid external conditions were a key factor steering the Canadian economy away from technical recession waters in Q4. Thursday saw the realize of Q4 Canadian GDP numbers that were led by a pop in exports. GDP managed to grow at a 1.0% annual rate, consistent with the full-year advance of 1.1%. While dismal in per capita terms, the modest headline growth is still much better than the consensus had anticipated a year ago. And that’s despite a variety of special factors—including drought, fires, and strikes—shaving at least a few ticks from growth.
That meager growth is weak enough to further chip away at inflation, and that’s without a recession—albeit barely. The modest growth and only gradual inflation progress are expected to keep the Bank of Canada on ice next week, and still sounding cautious.
Meanwhile, the mania around artificial intelligence looks to us like shades of euphoria. Not because the future impacts of AI on the economy are misguided or overstated (we think there are significant near- and long-term economic benefits), but because simply looking at the price appreciation of certain technology investments (and to a lesser extent, the market as a whole), at least gets our Spidey Senses going.
A 26% return in the stock market in 2023, powered by a nearly 60% gain from the tech sector, hearkens back to the 1990s. But more concrete comparisons to the tech bubble are, to us, both premature and overstated. Warm up that coffee because we are about to give you a bit of a history lesson: First, while last year's stock-market gain looks similar to calendar-year gains during the late 1990s, it shouldn't be lost that the bubble was filled by five consecutive years (1995-1999) of annual returns exceeding 20%. Perhaps more importantly, earnings across the dot-com stocks didn't back up those gains.
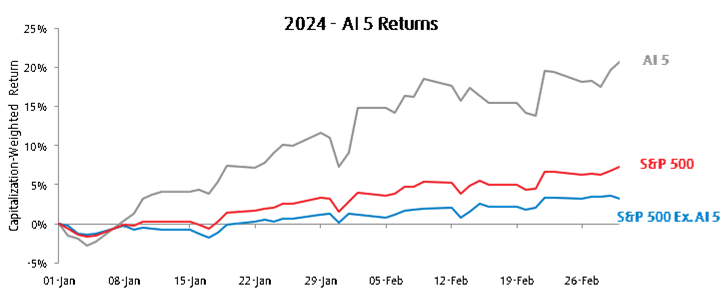
In the 1990s, meteoric gains were occurring in unprofitable dot-com companies, many of which had tantalizing growth prospects but no viable or sustainable earnings base. Today, the enthusiasm is concentrated in the largest companies with prolific as well as defensible earnings. NVIDIA, Microsoft, Alphabet (Google), Amazon and Meta (Facebook) generated a quarter of a trillion dollars in earnings in 2023. Could we see some slivers of reckoning in the most overheated spaces? Of course. Does this raise the potential for disappointments that spark a temporary pullback? Yes. Does this pose a more structural threat that sends the overall equity market in a sharp or severe dive? We don't think so.

Source: YTD returns for February 29, 2024 for the TSX and SP500 (without AI 5)
Note: The AI 5 includes: Meta, Microsoft, Amazon, Nvidia, and Alphabet
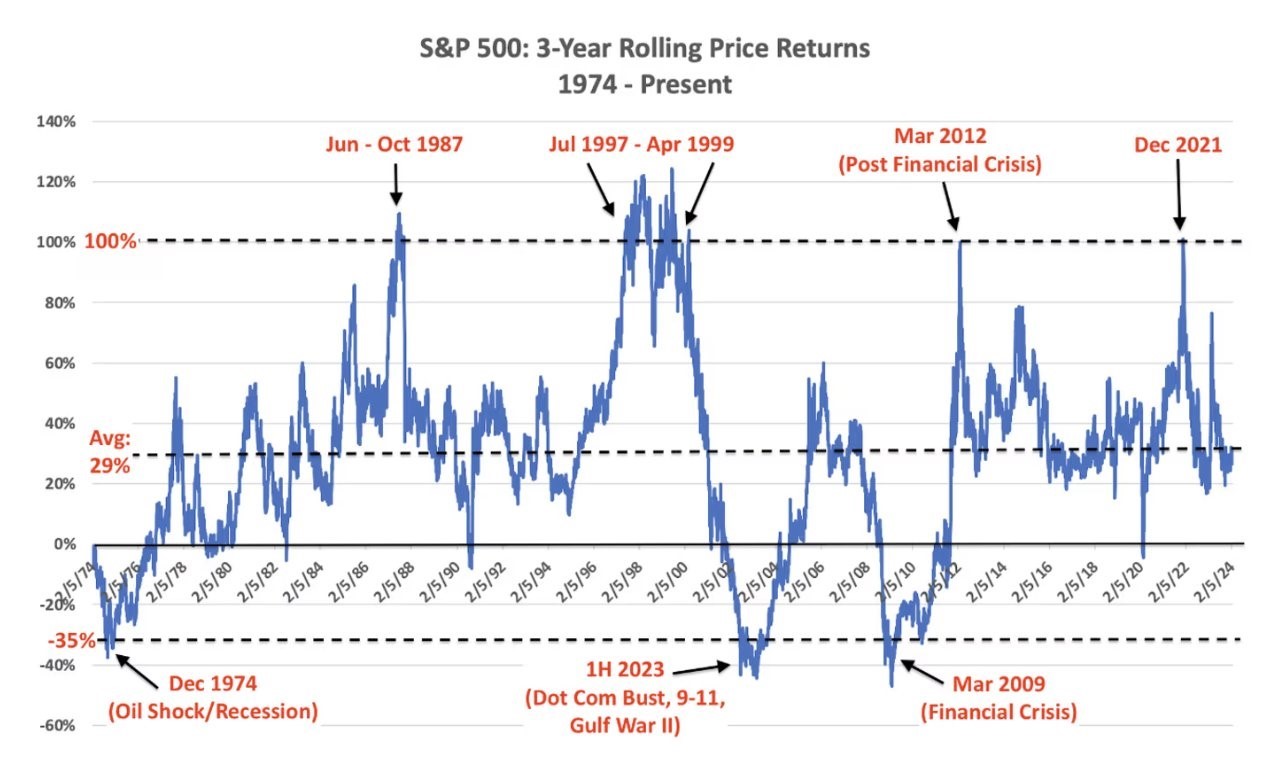
In fact, since 1974, the S&P 500 generated returns of at least 100% during the 3 years prior to every bubble peak. Over the last 3 years, the S&P 500 is only up about 31% which is basically right at the average rolling 3-year. In other words, data shows this likely isn’t a bubble.

Source: S&P 500 3-year rolling price returns since 1974.DataTrek Research
Avoiding reactionary-based decision-making is always a point of pride for seasoned Investment Manager. We believe the almost unimpeded rally off the October 2023 low and elevated valuation levels necessitate some near-term caution, if history is any sort of guide. However, we remain comfortable with our fundamentally bullish outlook and prefer patience unless incoming data suggest a change in our base case assumptions. Fortunately, the somewhat unexpected strength and resilience in earnings is likely to sustain stock prices since this is a trend we expect to continue throughout the year. Therefore, we would advise investors to not be too concerned should the market encounter some weakness in the coming months, as we expect, and instead treat any such periods as an opportunity to increase exposure to favored positions within portfolios.
The opinions, estimates and projections contained herein are those of the author as of the date hereof and are subject to change without notice and may not reflect those of BMO Nesbitt Burns Inc. ("BMO NBI"). Every effort has been made to ensure that the contents have been compiled or derived from sources believed to be reliable and contain information and opinions that are accurate and complete. Information may be available to BMO Nesbitt Burns or its affiliates that is not reflected herein. However, neither the author nor BMO NBI makes any representation or warranty, express or implied, in respect thereof, takes any responsibility for any errors or omissions which may be contained herein or accepts any liability whatsoever for any loss arising from any use of or reliance on this report or its contents. This report is not to be construed as an offer to sell or a solicitation for or an offer to buy any securities. BMO NBI, its affiliates and/or their respective officers, directors or employees may from time to time acquire, hold or sell securities mentioned herein as principal or agent. NBI will buy from or sell to customers securities of issuers mentioned herein on a principal basis. BMO NBI, its affiliates, officers, directors or employees may have a long or short position in the securities discussed herein, related securities or in options, futures or other derivative instruments based thereon. BMO NBI or its affiliates may act as financial advisor and/or underwriter for the issuers mentioned herein and may receive remuneration for same. A significant lending relationship may exist between Bank of Montreal, or its affiliates, and certain of the issuers mentioned herein. BMO NBI is a wholly owned subsidiary of Bank of Montreal. Any U.S. person wishing to effect transactions in any security discussed herein should do so through BMO Nesbitt Burns Corp. Member-Canadian Investor Protection Fund.