See You At The Track This Sunday!
DHL Wealth Advisory - Sep 08, 2023
Global equities gave back some of last week’s strong gains as investor attention continues to circle around interest rates. Government yields rose again this week with economic data in the US that came in hot for the month of August...
Global equities gave back some of last week’s strong gains as investor attention continues to circle around interest rates. Government yields rose again this week with economic data in the US that came in hot for the month of August.
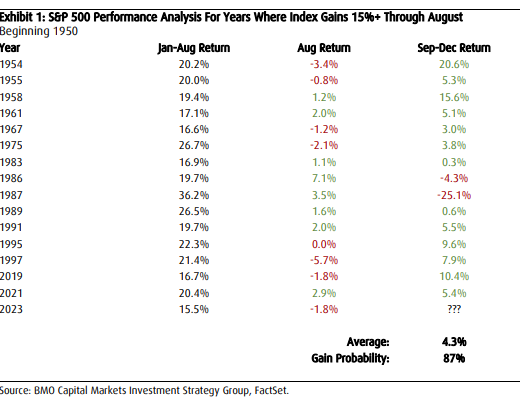
Despite the S&P 500 gaining 17.4% through the end of August, there remains a fair amount of investor skepticism that market momentum is sustainable, particularly following last month’s general weakness through the first several weeks which seemed to rekindle the earlier in the year bearish talking points that faded away following a particularly strong stretch from May through July. However, an examination of similar seasonal performances historically suggests the greater likelihood is for continued market gains, not losses. Indeed, this year’s gain puts it in roughly the 85th percentile for all years from 1950 and our work shows that this sort of performance for the first eight months of the year typically leads to continued gains for the remaining four months (Exhibit 1). For instance, there have been 15 calendar years where the S&P 500 gained 15%+ through August since 1950. The average return for the final four months those years was 4.3%. More important, the S&P 500 registered a September through December loss in only two of those years – 1986 (-4.3%) and 1987 (-25.1%) with Black Monday being almost entirely responsible for the latter. Interestingly, six of those years also had a negative August and yet the market still finished higher for the remaining four months in every instance. In other words, we do not put much thought into August performances given how slow trading activity for the month has tended to be historically.
Source: Belski - US Strategy Comment - The Call For Fall
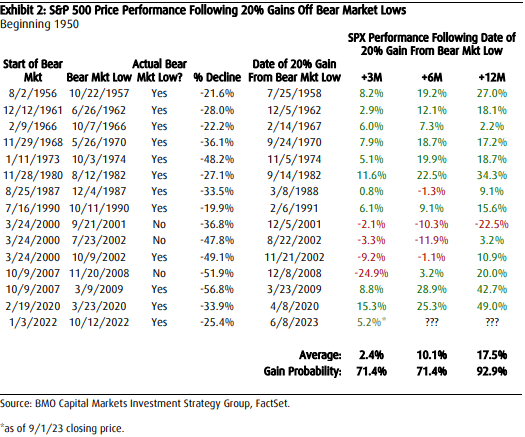
The S&P 500 closed more than 20% above its October 12, 2022 bear market price low on June 8th, a feat that some investors think is required to mark the start of a new bull market. For our part, we have been adamant in our belief for quite some time now that the 2022 mid-October low represented the price low for the cycle and that a new bull market has commenced. Nonetheless, historical analysis going back to 1950 shows that once the overall market climbed 20% above its previous price low, that low signaled the start of a new bull market in 10 of the 13 instances (Exhibit 2). The three exceptions came during the early 2000s tech bubble (twice) and during the Great Financial Crisis (once)− periods that do not resemble the current market environment, in our view. Finally, the analysis shows that once US stocks record a 20% gain from its previous price low, higher prices generally tend to follow. For instance, since 1950, in the six months following 20% S&P 500 gains off the lows, the index registered an average price return of 10.1% with gains occurring 71.4% of the time. In the subsequent 12 months, the S&P 500 logged a 17.5% gain, on average, with gains occurring 92.9% of the time.
Source: Belski - US Strategy Comment - The Call For Fall
Looking closer to home, we remain steadfast in our view that Canadian equities offer strong relative value, cash generation and stability as global markets travel down the long and increasing curvy road of normalization. From our perspective, the sharp underperformance of the TSX in the first half of the year (especially relative to our neighbours to the south) has been overdone; and instead we believe Canadian equities remain a key area of multi-year relative stability. Given the strong relative value position and growth profile of the TSX, we expect this trend to continue through 2023, thereby adding a level of stability as the US continues to shift (at times wildly) between growth and value.
Yes, fundamentally Canadian equity markets display strong and stable cash flow generation. Combined with the near-record relative valuation discount advantage is among the primary reasons we believe the TSX is well positioned to outperform versus the US and other global markets as valuations normalize. Additionally, Canada’s strong corporate cash position implies capital deployment is likely to remain a key theme in 2023 as companies continue to allocate excess free cash flow. As such, we continue to believe investors should maintain a strong allocation to Canadian equities and use periods of weakness as opportunities to add to core longer-term positions. Overall, akin to the US, we believe active investment strategies will be a key pillar for 2023. In other words, investors will need to be nimble throughout the year rotating in and out of areas to take advantage of what we think will be constantly evolving market conditions in order to deliver outperformance.
Lastly, the Bank of Canada, as expected, held rates steady at 5% this Wednesday after a pair of 25bps summer hikes. We still lean to the view that the Bank has done enough. It will be a nervous couple of months, as Canada’s headline inflation rate is also about to take a serious trip north on higher energy prices. After falling more than 20% below year-ago levels as recently as June, gasoline is now up 8% y/y, which alone will take top-line inflation to around 4% in the next few months.
Source: BMO Economics Talking Points: Oil and Trouble, on the Double
However, the domestic growth picture is likely to keep the Bank at bay. First, it would be a very brave central bank indeed to be even considering hiking rates with the latest quarterly GDP report printing negative. And, even with the solid August jobs report, the underlying story seems to be that the labour market is loosening. To wit, the average jobless rate of the past three months is now nearly 5.5%, compared with last year’s ultimate low of 4.9%, an increase of nearly 0.6 percentage points. Moreover, the job vacancy rate is steadily coming down from the highs of early last year (5.7%) to a much calmer level now (4.2%).
Source: BMO Economics Talking Points: Oil and Trouble, on the Double
The opinions, estimates and projections contained herein are those of the author as of the date hereof and are subject to change without notice and may not reflect those of BMO Nesbitt Burns Inc. ("BMO NBI"). Every effort has been made to ensure that the contents have been compiled or derived from sources believed to be reliable and contain information and opinions that are accurate and complete. Information may be available to BMO Nesbitt Burns or its affiliates that is not reflected herein. However, neither the author nor BMO NBI makes any representation or warranty, express or implied, in respect thereof, takes any responsibility for any errors or omissions which may be contained herein or accepts any liability whatsoever for any loss arising from any use of or reliance on this report or its contents. This report is not to be construed as an offer to sell or a solicitation for or an offer to buy any securities. BMO NBI, its affiliates and/or their respective officers, directors or employees may from time to time acquire, hold or sell securities mentioned herein as principal or agent. NBI will buy from or sell to customers securities of issuers mentioned herein on a principal basis. BMO NBI, its affiliates, officers, directors or employees may have a long or short position in the securities discussed herein, related securities or in options, futures or other derivative instruments based thereon. BMO NBI or its affiliates may act as financial advisor and/or underwriter for the issuers mentioned herein and may receive remuneration for same. A significant lending relationship may exist between Bank of Montreal, or its affiliates, and certain of the issuers mentioned herein. BMO NBI is a wholly owned subsidiary of Bank of Montreal. Any U.S. person wishing to effect transactions in any security discussed herein should do so through BMO Nesbitt Burns Corp. Member-Canadian Investor Protection Fund.