Welcome to July and the second half of the trading year.
We are in the Green Zone in our Stoplight Indicator – or mid-long term equity Action Signal. The market indexes were all up or close to previous highs on the month. In the U.S., we are seeing this being led once again by technology and growth stocks, or better known as the Magnificent Seven.
In Canada, our index contains only a small segment of technology, and thus, we are in a longer-term sideways move since April, though commodities like oil and gold have managed to push the market back close to its high of the year at about 6.25%.
The Technical
I will apologize in advance as this months e-Newsletter is going to be a bit more technical in nature. This is because it is important to look at what the computers are saying and doing. Remember, the computers now run over 80% of the trading since 2007 in the exchanges. Should you have questions or need some clarification, please send us an email or give us a call anytime.
Divergence
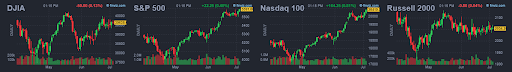
Our concern continues to be the divergence between the tech driven Nasdaq and SP500 versus the broader markets such as the Dow and the mid to small caps in the Russell. This divergence means that tech market stocks are doing great, but the rest of the market, such as industrials, financials and small to mid size companies (known as the backbone of any economy), is not moving. Longer term this is not sustainable.
There are four charts below. The first is the DOW. It is the one we hear most about in the news. It is the most representative of the broader market and economy. It includes the aforementioned industrials, financials and health care, consumer stocks, etc., and holds very little technology stocks. As of writing, it is up only just over 4% this year. The fourth chart below is the Russell, which represents the small to mid-size companies. It is up less than a half percent year to date.
By comparison, the second and third charts are the SP500 and Nasdaq, which are more technology stock driven. They hold 35% and 100% technology respectively, and are up significantly at 16-20% respectively. That is a huge divergence between technology and the rest of the market.
And yet, technology stocks only make up 5% of the U.S. economy! Caution in this sector is now becoming even more important.
The majority of the time, all of the indexes move together. Recently, the S&P 500 and the NASDAQ 100 seem to be outliers due to the size of just a few technology companies. The immense weighting of a few of these largest companies far outweigh the rest of the ones in those stock indexes. For example: say tonight the bottom 465 companies in the S&P 500 Index declare bankruptcy and become worthless. Tomorrow the index would essentially be the same value. That is how much the top 35 companies influence the index.
A few of the best performing money managers only look at the top 35 companies in the index. They set aside any in the group likely to underperform and buy the remaining few stocks, and then they buy and hold. They may have outperformed the index in the positive years, but that strategy did not mitigate against the large losses during declining years, especially going into the tech wreck of 2000. The divergence between the tech markets and the broader and equally weighted market indexes tells us the US Economy is not booming as much as the few tech stocks indicate but is trading sideways instead. This same divergence occurred in 2000. The tech bubble resulted in a crash in technology that did not affect the rest of the US economy. As you can see from the chart below, 2000 was one of the greatest performance years for almost every sector except technology.
As investors, we need to avoid losses as they have a more significant impact on our portfolios than the profits. If the portfolio drops 50%, you need a 100% return from the bottom just to get back to your starting point.
We also have some comments from the BMO Nesbitt Burns Portfolio Management Team which is seeing similar concerns for the market:
AI & The FOMO (Fear of Missing Out) Market
BMO Nesbitt Burns Portfolio Management Team
"Anyone who believes exponential growth can go on forever in a finite world is either a madman or an economist."
-Kenneth Boulding, American Economist.
Most people tend to be rational and value conscious. Case in point, Costco, a favourite retailer of ours, has built an empire by providing great quality products at excellent prices. Consumers clearly like that business model. In the case of investments however - and particularly stock investments - there are times when investors forget those instincts and decide to buy shares simply because they keep going up. Right now is one of those times in our opinion, and we believe Artificial Intelligence "arms dealers" are forming a classic investment bubble as shown by their extremely high price-to-sales valuation multiples (by arms dealers, we mean semiconductor companies such as ARM Holdings, Nvidia, and Broadcom who provide the chips to train large language models). Now a spoiler alert: investment bubbles NEVER end well. This is true whether one looks at tulips in the 17th century, railroads in the 19th century, or early internet plays at the start of the 21st century. That being said, asset prices can continue inflating for far longer than many expect and that is particularly true of emerging themes that capture traders' collective imaginations. In the final analysis though, while AI stocks may go higher still, the long-term risk/reward is looking decidedly less compelling at current valuation levels. Using real estate as an example, overpaying for a house lowers expected long-term gains; the same is true for shares of companies.
Bottom Line
We are now moving into the second half of the year. For us, it is an important time to review all our matrixes and charts, including other asset classes, sectors, indexes and international markets on those longer-term time frames, and to remember to follow our rules.
We are in the Green Zone. Should the tech markets generally hold here, July does tend to be a strong period seasonally. We may look to add some of that exposure in a limited fashion and take part in the continued rise, but also be prepared to sell when the trend breaks. We are not buy and hold. We also hold a number of defensive positions which are protecting us on the down days and in the event that markets break down.
Otherwise, with interest rates still not coming down (which is a difficult environment for stocks to move higher), we will remain cautious for now and continue with our one foot on the gas and one on the brake.
- John, Victor and Megan
We do always look forward to our client meetings and you don’t have to wait until the next scheduled contact.
Should at any time you would like to meet with us, please do contact us, by phone at 905-727-5040 or email at Ridd.Associates@nbpcd.com.
We would be pleased to setup an in-person meeting, phone meeting or virtual meeting, at a time that is convenient for you.
We look forward to reviewing your portfolio and wealth plan as well as answering any questions you may have.
If you know someone who can benefit from what you have learned today, please feel free to share this newsletter with them.