The Yield Curve.
Robin Kingsmill - Jul 12, 2022
It’s a snapshot of the June 27 Canada Bond and its yield, and it issued by many to map a strategy for their assets.
Click Here to Read Original PDF
It’s a snapshot of the June 27 Canada Bond and its yield, and it issued by many to map a strategy for their assets.
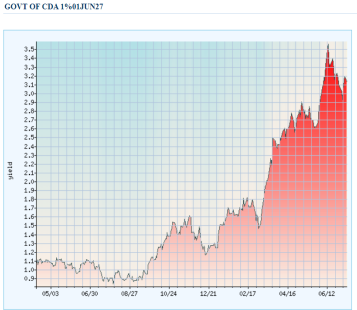
It’s a snapshot of the June 27 Canada Bond and its yield, and it is used by many to map a strategy for their assets. This graph illustrates April 2021 through July 11, 2022.
This graphic shows bond yields spiking and already coming back down. The Wall Street Journal says that mortgage rates in the US are going down which, the pundits know, means that we should expect a recession next year. In the US, the variable Mortgage Rates are based on the 30 year Bond Rate. (In Canada, we use a different system, variable mortgage rates are based on Prime)
Clearly there is an opportunity here, how to capitalise on it? Are these opportunities getting built into the Market now? Should we lock in the best rates now? When will the yields’ drop begin in earnest? Do we hear the ‘band warming up?’ What does this graph say?
Or do you wait until it’ feels like’ time to lock in? Will the Market get there before you? You bet they will. They are watching graphs like this and several more. Those thinking to ‘catch this wave’ need to know that the actions to affect Inflation are already baked in. We know interest rates are going up. They have said it!
Look at the graph. If Interest Rates are going up, why do the Bond yields show going down over time? Because Markets are at least 6 months ahead of today.
What is happening now, that will affect the Bond market? It’s already showing clearly in the 5 yr. rate in Canada. There’s your neon sign to act now. The trick is to be able to see it.
You should know: The opinions, estimates and projections contained herein are those of the author as of the date hereof and are subject to change without notice and may not reflect those of BMO Nesbitt Burns Inc. ("BMO NBI"). Every effort has been made to ensure that the contents have been compiled or derived from sources believed to be reliable and contain information and opinions that are accurate and complete. Information may be available to BMO NBI or its affiliates that is not reflected herein. However, neither the author nor BMO NBI makes any representation or warranty, express or implied, in respect thereof, takes any responsibility for any errors or omissions which may be contained herein or accepts any liability whatsoever for any loss arising from any use of or reliance on this report or its contents. This report is not to be construed as an offer to sell or a solicitation for or an offer to buy any securities. BMO NBI, its affiliates and/or their respective officers, directors or employees may from time to time acquire, hold or sell securities mentioned herein as principal or agent. BMO NBI -will buy from or sell to customers securities of issuers mentioned herein on a principal basis. BMO NBI, its affiliates, officers, directors or employees may have a long or short position in the securities discussed herein, related securities or in options, futures or other derivative instruments based thereon. BMO NBI or its affiliates may act as financial advisor and/or underwriter for the issuers mentioned herein and may receive remuneration for same. A significant lending relationship may exist between Bank of Montreal, or its affiliates, and certain of the issuers mentioned herein. BMO NBI is a wholly owned subsidiary of Bank of Montreal. Any U.S. person wishing to effect transactions in any security discussed herein should do so through BMO Nesbitt Burns Corp. Member-Canadian Investor Protection Fund.