Spring/Summer 2026 Newsletter
Fortin Wealth - May 25, 2026
Owning the Backbone of Change | Written By Christine Fortin
Reflections from a Fireside Chat with CEO of Brookfield Infrastructure, Bruce Flatt
I had the unique opportunity in February of this year to be part of a fireside chat with Bruce Flatt. A rare visit to Canada on his way through from London UK to the Superbowl, with a stop in Toronto for the fireside (and, I’m sure some investment discussions and maybe even a visit with his old employee, Mark Carney).
There are moments in investing where the signal becomes unmistakable—when structural change moves from theory to inevitability.
My recent conversation with Bruce Flatt was one of those moments.
What emerged was not simply a set of trends, but a clearer view of what will matter most over the coming decades — and where capital must be deliberately positioned. Now, our clients know that we are one of the early adopters into infrastructure – adding it into the portfolio well over a decade ago. So, learning how this investment remains relevant in a changing economy for me personally was equal parts fascinating and confirming of our institutional led investment approach.
The Discipline of Compounding
At the centre of the discussion was a simple idea:
If you can compound capital at 12–14% over long periods of time, extraordinary outcomes follow.
Not through prediction.
Not through activity.
But through ownership — of the right assets, held long enough.
This perspective is crucial as we enter an unprecedented infrastructure build cycle. (I wrote this before the Carney announcement stating exactly this).
Recognizing Change—But Not Chasing It
A key lesson:
You do not need to be early. You need to be right.
The discipline is in waiting until a shift becomes real, essential, and economically viable — and then deploying capital with conviction.
We saw this in solar. What once required subsidies is now the lowest-cost form of power globally.
We are now seeing similar inflection points elsewhere — most notably in energy itself.
Don’t chase an asset until it becomes a solid investable choice. Meaning it is well integrated into daily society, until then, it is simply roulette – think bitcoin. Is the infrastructure there for bitcoin to support the long-term viability and implementation in daily commerce? Not yet. Thus, how can you make a confident investment without knowing the definitive revenue stream?
A More Consequential Observation: Energy Has Been Quietly Stable
For nearly 25 years, something unusual occurred:
Global energy consumption remained remarkably flat. FLAT. Think about what your home or office looked like 25 years ago and imagine that energy consumption hasn’t moved in 25 years.
Not because demand was stagnant — but because efficiency gains offset growth.
We used more devices, more computing power, more electricity —
but we also became better at using less.
That equilibrium is now breaking. We are expected to double energy consumption in the next 15 years. How is that even possible to build out the infrastructure to meet the demand?
Digitalization Is Now an Energy Story – spoiler alert: not which chip company to buy
The digital economy is often misunderstood as “light”.
In reality, it is becoming one of the largest drivers of electricity demand globally.
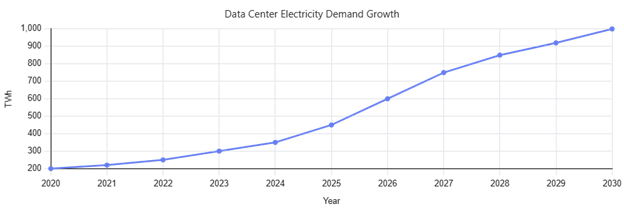
Data Centre Power Demand Growth
The Repricing of Power
We are entering a fundamentally different phase.
- Energy demand is now expected to increase dramatically over the next 10–15 years
- In many forecasts, electricity demand alone could double — driven by data centres, electrification, and industrial reshoring [newswire.ca], [thedeepdive.ca]
This is not incremental.
It is a structural break.
And importantly, it is not demand that is uncertain — it is supply.
As Bruce Flatt noted, the constraint is no longer technology.
The limiting factor is power — access to it, transmission of it, and the ability to build it at scale.
Digitalization Is Driving Physical Demand
One of the more misunderstood dynamics today is that the digital economy is becoming increasingly energy-intensive.
- Data centre electricity demand alone is expected to more than double by 2030 [gartner.com], [spglobal.com]
- AI infrastructure is rapidly becoming one of the largest incremental drivers of global electricity consumption
What appears intangible is, in reality, deeply physical.
Every layer of AI and cloud computing relies on:
- Power generation
- Grid connectivity
- Cooling and storage infrastructure
Which leads to a simple, but important conclusion:
The future of technology is constrained by the availability of energy.
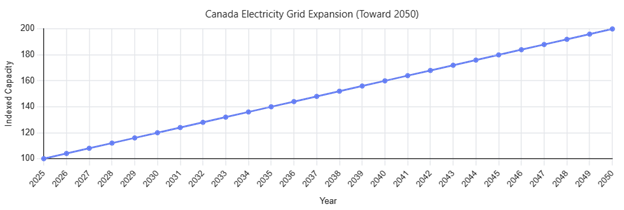
How Are We Responding? A Canadian Case Study
What was particularly notable is that this shift is no longer just an investment theme — it is now public policy.
Today as I write, Thursday May 14th, Prime Minister Mark Carney announced Canada’s National Electricity Strategy — a direct response to these pressures. This is after building a Sovereign fund a couple of weeks ago, to encourage companies to partner in building out infrastructure. The announcements on resource partnerships and rebooting aging mines with rare minerals is happening at a pace not seen in my lifetime.
At its core:
- Canada aims to double its electricity generation and grid capacity by 2050 [cbc.ca], [bloomberg.com]
- This will require over $1 trillion in investment, spanning generation, transmission, and storage [bloomberg.com]
- The plan includes:
- Expanding hydro, renewables, and nuclear
- Integrating provincial grids into a more unified national system
- Allowing natural gas to play a complementary role for reliability and baseload power [newswire.ca], [cbc.ca]
Importantly, this is not framed as optional.
It is framed as foundational.
Electrification underpins competitiveness, affordability, and energy security.
This aligns directly with what we heard from Brookfield:
The world is not just decarbonizing — it is rebuilding its entire energy system at scale.
The Scale of What Lies Ahead
The implication is difficult to overstate.
We are moving into a period where:
- Entire power grids must be rebuilt or expanded
- New asset classes (storage, transmission, distributed energy) become essential
- Capital requirements move from billions to trillions
Even within a single segment—data infrastructure—the scale has shifted dramatically:
- Projects once measured in hundreds of millions
- Now measured in tens of billions
This is not a typical investment cycle.
It is generational.
Why This Matters for Long-Term Capital
For families who think in decades, not quarters, this introduces a clear set of considerations:
1. Power Becomes the Defining Asset
Access to reliable energy will underpin:
- Economic growth
- Technological advancement
- Industrial competitiveness
2. Infrastructure Is No Longer Peripheral
It is central. The assets that generate, store, and move energy are becoming the backbone of the global economy.
3. Private Markets Will Play a Critical Role
Much of this buildout:
- Requires long-duration capital
- Demands operational expertise
- Exists beyond the reach of traditional public markets
- Governments simply don’t have the capital. The end.
- This is not an investment in your grandparent’s infrastructure (power plants etc.), this is an investment in your grandchildren’s infrastructure that will be sustainable and more efficient sources of power than current power generation.
4. Scarcity Drives Return. How to Capitalize on this concept (i.e.. what to Invest In)
The challenge is not identifying demand.
It is meeting it.
And that gap — between demand and deliverable supply — is where disciplined capital compounds.
This means that it will not be limited to building more power plants like we see today.
It means visiting alternatives:
- Nuclear
- Solar
- LNG
- WTE (waste to energy)
From our Grandparent’s Infrastructure to our Grandchildren’s Infrastructure: an Example of Accessing Power Generation of Today
Most will be handled through private markets. Specifically industrializing families who are pivoting and looking for boots on the ground investments. Note – Canada is an infrastructure superpower, and it is shocking how little we have. When Carney was in Davos, he only took 3 meetings and one of them was with an infrastructure private investment firm, EQT. The purpose was to solicit private investment to access our superpower buildout. (another was with a power wall plate company).
Private Market investments is currently 150 trillion for institutional and 150 trillion from private wealth. Specifically:
- Sovereign funds 24%
- Pension plans 17%
- Endowments 34%
- Insurance companies 7%
- Families (private wealth and family offices) 18%
** source: Hamilton Lane presentation at national alternative investment conference
Consider WTE (waste to energy). A company like ReWorld.
ReWorld is a municipal solid to waste to power company. In short, it burns trash and creates power.
- Converts non-recyclable waste into electricity and steam using high temperature processes.
- Produces continuous, baseload electricity – power is available 24/7 regardless of weather.
- It is cleaner than power plants
- It solves multiple issues including management of household waste.
- They source high margin trash (they pay for trash) so helps municipalities manage costs with respect to waste. The cost is less than municipalities paying to dump trash to landfills.
- They have long term contracts to ensure they have access to cash and then make money selling power.
- Most renewable energy sources are intermittent (wind, solar). This is 24/7.
- Growth of WTE is structurally growing driven by: urbanization, landfill restrictions, ESG mandates.
- Expanded from 50 – 90 facilities across North American (source waste dive)
- Have created integrated verticals:
- Alternative fuels (ReKiln)
- Wastewater treatment (ReDrop)
- Logistics (ReMove)
- Carbon offsets (ReCredit)
- Clean energy and circular economy business. Circular economy businesses *is* investing in our grandchildren’s economy and infrastructure.
This is an example of how we need to think differently about infrastructure investment and look for those opportunities which are available to accredited investors and hopefully will be mainstream for the masses at some point.
A Final Reflection
Perhaps the most telling point Bruce made was this:
Roughly half of what they own today did not exist as an investable asset class 15 years ago.
It is a quiet reminder.
The next decade of wealth creation will not come from familiar categories — but from owning the infrastructure that enables the next phase of global growth.
And increasingly, that comes back to one thing:
Power of the Future.
Not as a theme.
Not as a trade.
But as a foundational asset — essential, scarce, and deeply tied to how the world evolves from here.
References:
- Prime Minister Carney announces forthcoming National Electricity Strategy
- Canada Unveils C$1 Trillion Plan to Double Electricity Grid Capacity by 2050 | the deep dive
- Gartner Says Electricity Demand for Data Centers to Grow 16% in 2025 and Double by 2030
- Global data center power demand expected to almost double by 2030 | S&P Global
- Natural gas to play key role in strategy to double Canada’s electricity grid by 2050 | CBC News
- What to Know about Carney’s Plan to Boost Canada’s Electricity Output - Bloomberg
Fifty Years in Perspective – The punchline will become obvious | Written By Christine Fortin
Consider a few moments in time.
1975
The world was marked by instability:
- The fall of Saigon
- Cold War tensions
- Political violence
- Oil shocks still echoing through the economy
- SNL debuts.
- Margaret Thatcher becomes the first woman leader of Britain’s Conservative Party.
- An American and Soviet spacecraft link up in orbit.
At that time:
- Global population sat at roughly 4 billion, with half living in extreme poverty
- The U.S. economy was just over $5 trillion
- The S&P 500 stood at 90
- Earnings $7.71
- Dividend $3.73
US Postage stamp (marker of inflation) is $0.1
1985
- The early seeds of globalization and technology were taking hold:
- The rise of Reagan and Gorbachev
- The internet domain name is created.
- The birth of modern computing with Windows 1.0
- The formation of early internet infrastructure
- Song of the year “We Are The World”
- Leaded gasoline is banned.
- Coca Cola launches “New Coke”
- The S&P500 stood at $211.28
- Earnings $15.68
- Dividend $8.20
- US Postage stamp $0.22
Markets had advanced. The global economy was expanding. But few would have described the environment as “certain.”
1995
The world was reshaping again:
- The early internet era
- Rapid globalization
- Continued geopolitical tensions
- The Oklahoma City bombing ist he greatest domestic terrorist atrocity in American History up until that point.
- First women to preside over the US Supreme Court and First women to pilot a Space Shuttle.
- Rock and Roll Hall of Fame and Museum open in Cleveland.
- Netscape’s IPO marked the beginning of something that, at the time, few fully understood.
- Global population: 5.7 billion
- U.S. population: 266 million
- U.S. real GDP: $10.28 trillion
- S&P 500 year-end close: 615.93
- Earnings: $37.70
- Dividend: $14.17
- US postage stamp $0.32
2005
The pace of change accelerated:
- 9/11
- The birth of YouTube with the first video uploaded
- Advances in space exploration
- Global terrorism reshaping policy and markets
- Pope John Paul II dies.
- Hurrican Katrina devastates and American land mass larger than Great Britain.
- July 7th becomes London’s 9/11
- At the same time, poverty was already beginning to decline meaningfully across the developing world.
- Global population: 6.5 billion, but by the turn of the century, the rate of extreme poverty has fallen to one person in three.
- U.S. population: 296 million
- U.S. real GDP: $14.37 trillion
- S&P 500 year-end close: 1,248.29
- Earnings: $76.45
- Dividend: $22.38
- US postage stamp $0.37
2015
A world still grappling with:
- Political uncertainty
- Conflict in the Middle East – ISIS casting the middle east into chaos.
- Migration challenges – Reguees pouring into Europe.
And yet, by this point:
- Extreme poverty had declined to 1 in 10 people globally
- The global middle class was expanding
- Global population: 7.29 billion, only one in ten of whom live in extreme poverty.
- U.S. population: 322 million
- U.S. real GDP: $18.9 trillion
- S&P 500 year-end close: 2,043.94
- Earnings: $106.32
- Dividend: $43.16
- US postage stamp $0.49
2025
A world that still appears complex, even unsettled:
- Geopolitical tensions remain
- Policy uncertainty persists – for only the second time in history, a US president begins serving his non-consecutive second term.
- American B-52 bombers fly 37 hours nonstop to destroy Iran's nuclear facilities with bunker buster bombs of a type never before used in combat
- Headlines continue to amplify risk
- Greatest 7th game of the World Series in History.
And yet:
- Global population exceeds 8 billion
- The U.S. economy approaches $24 trillion
- The S&P 500 has reached nearly 6932 (as of Christmas eve)
- Earnings (full year estimate): $270
- Dividend (full year estimate): $80
- US postage stamp: $0.78
What the Data Actually Tells Us
Over the past five decades:
- Global population doubled
- Extreme poverty fell dramatically, from one in two people to closer to one in ten
- The U.S. economy expanded more than fourfold in real terms
- Per capita income increased materially, reflecting real improvements in living standards
- Corporate earnings and dividends grew steadily
And importantly:
Equity markets compounded at approximately 12% annually, despite inflation, recessions, and geopolitical shocks.
A $100,000 investment, left untouched and allowed to compound, would have grown to multiples of its original value—without requiring precision, timing, or prediction.
Understanding the Drivers of Progress
This progress did not occur by accident.
It was underpinned by two enduring forces.
1. The Expansion of Market-Based Systems
Over this period, we saw:
- The gradual spread of economic freedom
- The decline of centrally planned systems
- Increased global trade and capital flow
This allowed capital—and ideas—to move more efficiently.
2. The Compounding Effect of Technology
From mainframes to personal computers, to the internet, to mobile computing—and now artificial intelligence— Each wave built on the last.
Today, the computing power available in a handheld device far exceeds what was available globally just decades ago.
This is not linear progress.
It is exponential.
A Quiet but Important Insight
Perhaps the most important takeaway is not the magnitude of progress—but its consistency.
At any given moment:
- There were reasons to pause
- Reasons to worry
- Reasons to believe the world was becoming more unstable
And yet, over time:
- Innovation continued
- Economies expanded
- Living standards improved
The Disconnect Between Perception and Reality
One of the challenges today is that we experience the world through a constant stream of information.
Much of that information is:
- Immediate
- Negative
- Designed to capture attention
It focuses on disruption—rarely on continuity.
But markets, economies, and human progress tend to follow a different path.
They move forward quietly, often unevenly, but persistently.
Closing Reflection
We rarely recognize progress while we are living through it.
It only becomes obvious in retrospect.
What feels uncertain today often becomes, over time, part of a much larger and more consistent pattern.
And for those willing to remain patient—to stay invested, disciplined, and anchored in long-term thinking—that pattern has historically been one of meaningful and enduring growth
References:
- Prime Minister Carney announces forthcoming National Electricity Strategy
- Canada Unveils C$1 Trillion Plan to Double Electricity Grid Capacity by 2050 | the deep dive
- Gartner Says Electricity Demand for Data Centers to Grow 16% in 2025 and Double by 2030
- Global data center power demand expected to almost double by 2030 | S&P Global
- Natural gas to play key role in strategy to double Canada’s electricity grid by 2050 | CBC News
- What to Know about Carney’s Plan to Boost Canada’s Electricity Output - Bloomberg
Liquidity, Money Supply and the Velocity of Money: The “Invisible Pulse” Behind Growth and Inflation | Written By Ryan Lidder
Understanding the Link Between M2, QE, Money Velocity and Market Movement
Executive Summary
Liquidity is one of the most important macro forces behind market cycles. M2 measures the broad amount of money available in the economy, QE is one method central banks use to add liquidity and lower longer-term rates, and velocity of money determines how actively that money circulates through the real economy. The S&P 500 is influenced by all three through valuation multiples, earnings growth, interest rates and investor risk appetite.
Why Liquidity Matters
Financial markets are often explained through earnings, interest rates, inflation, valuations and investor sentiment. Those factors matter. But beneath many major market cycles sits another powerful force: liquidity.
Liquidity refers to the availability of money and credit within the financial system. When liquidity is abundant, capital tends to move more freely into businesses, real estate, bonds, private markets and public equities. When liquidity contracts, investors often become more selective, financial conditions tighten and valuation multiples can come under pressure.
Three concepts are especially important for understanding this relationship: M2 money supply, quantitative easing (QE) and the velocity of money. Together, these help explain why equity markets, including the S&P 500, often respond strongly to changes in monetary policy and financial conditions.
M2: The Amount of Money in the System
M2 money supply is a broad measure of liquid money available in the economy. It includes cash, chequing deposits, savings deposits, small time deposits and retail money market funds. FRED’s M2 series is published by the Federal Reserve and, as of March 2026, U.S. seasonally adjusted M2 was approximately $22.7 trillion. [1]
In simple terms, M2 represents the pool of liquid purchasing power available to households, businesses and investors. When M2 is growing quickly, more money is available for spending, saving, lending and investing. When M2 slows or contracts, the financial environment often becomes less supportive.
That does not mean every new dollar in M2 flows directly into the stock market. Some money remains in bank deposits. Some is used for consumption. Some pays down debt. Some moves into bonds, real estate, private businesses or money market funds. But at the broad macro level, a larger pool of liquidity can support higher asset prices, especially when interest rates are low and investors are encouraged to seek higher returns.
QE: How Central Banks Add Liquidity
Quantitative easing, or QE, is a monetary policy tool used when central banks want to ease financial conditions beyond simply cutting short-term interest rates. Under QE, the Federal Reserve buys longer-term securities such as Treasury bonds and agency mortgage-backed securities. The goal is to lower longer-term yields, support credit markets and make broader financial conditions more accommodative. [2][3]
The New York Fed describes the large-scale asset purchase programs after 2008 as a way to put downward pressure on longer-term interest rates, support mortgage markets and improve broader financial conditions. [3]
When the Fed buys securities, it increases reserves in the banking system and removes longer-duration bonds from the market. This tends to push bond yields lower. As yields fall, investors often move further out on the risk spectrum in search of return. That portfolio rebalancing process can support corporate bonds, real estate, private assets and equities.
For the S&P 500, QE can help through two main channels: lower discount rates, which increase the present value of future earnings, and higher risk appetite, which can lead investors to pay higher valuation multiples for equities.
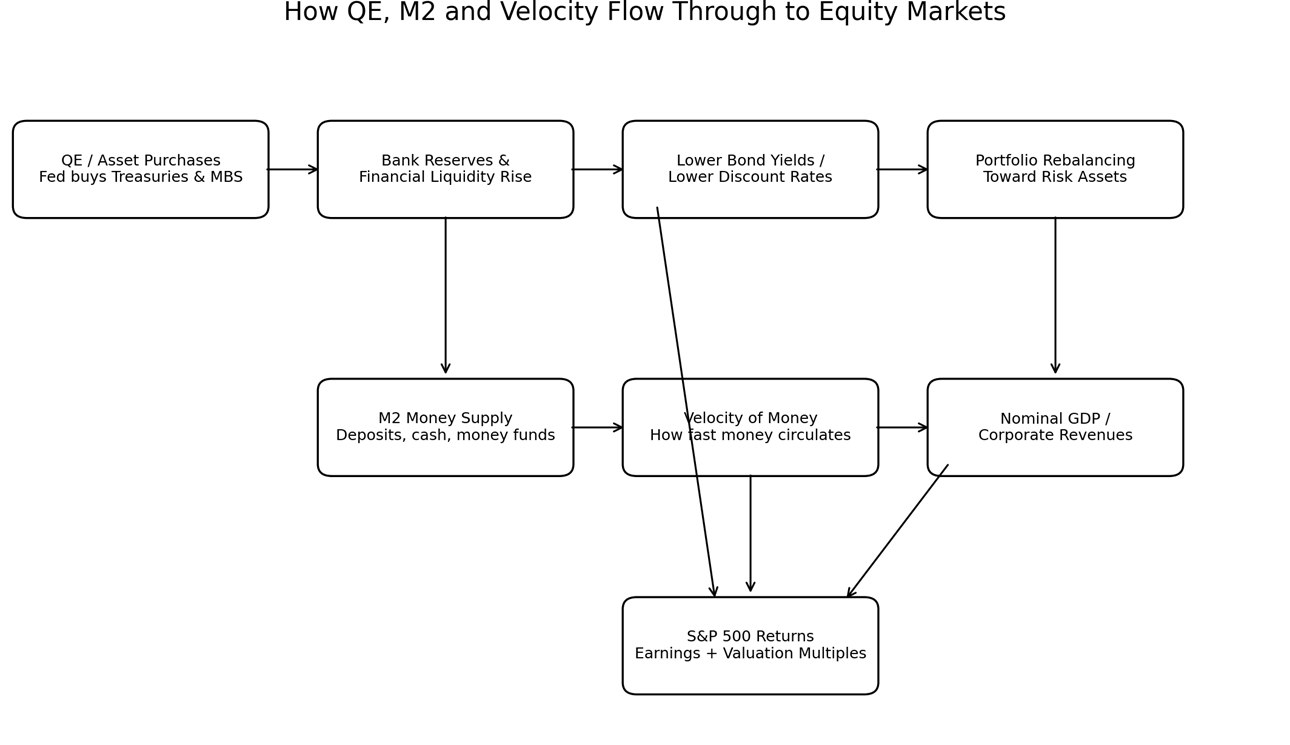
Figure 1: How QE, M2 and velocity flow through to equity markets.
The Missing Link: Velocity of Money
Money supply alone does not tell the full story. The other critical variable is velocity of money.
Velocity measures how frequently money is used to purchase goods and services. FRED defines M2 velocity as the ratio of quarterly nominal GDP to the quarterly average of M2 money stock. In plain language, it measures how often each dollar of M2 turns over in the economy. [4][5]
The basic relationship is: Nominal GDP = Money Supply × Velocity. Or, stated another way: Velocity = Nominal GDP / Money Supply.
This is crucial. If the money supply increases but velocity falls, the added money may not produce as much real economic activity or inflation. It may sit in bank accounts, reserves, money market funds or financial assets. If the money supply increases and velocity rises, the money is actively circulating, which can support stronger nominal GDP, corporate revenues and earnings.
FRED reported M2 velocity at approximately 1.411 in Q1 2026, meaning each dollar of M2 was turning over a little more than once per year in relation to nominal GDP. [4]
A useful analogy is: M2 is the amount of fuel in the tank. QE is one way of adding fuel. Velocity is how quickly the engine burns that fuel.
Why Liquidity Can Lift Asset Prices Before the Economy Accelerates
One of the most important market lessons from the post-2008 period is that liquidity can support asset prices even when the real economy remains relatively subdued.
After the Global Financial Crisis, the Federal Reserve expanded its balance sheet through multiple rounds of QE. Those policies lowered interest rates and supported financial markets. However, M2 velocity remained in a long-term downward trend. [3][4]
That combination produced an important outcome: financial liquidity increased, interest rates remained low, investors moved into risk assets, equity valuations expanded, but money did not circulate through the real economy as quickly as in prior decades.
As a result, the post-2008 period was highly supportive for financial assets but did not immediately produce the kind of broad consumer price inflation many expected. A key reason was that money velocity remained weak. Liquidity flowed into markets, but the turnover of money in the real economy stayed relatively low.
Why the COVID Period Was Different
The COVID period was different because monetary stimulus was paired with very large fiscal stimulus. QE expanded the Federal Reserve’s balance sheet, but government transfers and emergency support programs also pushed money directly into household and business accounts. This caused a sharp increase in M2 during 2020 and 2021. [1][6]
At first, velocity collapsed because the economy was partially shut down. People and businesses had more cash, but fewer opportunities to spend it. As the economy reopened, however, that stored liquidity began circulating more actively.
This combination, high money supply plus recovering velocity, was much more powerful than QE alone. It supported nominal GDP growth, corporate revenues, consumer demand and eventually inflation pressure.
The key distinction is QE with low velocity can inflate financial assets. QE and fiscal stimulus with rising velocity can inflate both asset prices and the real economy.
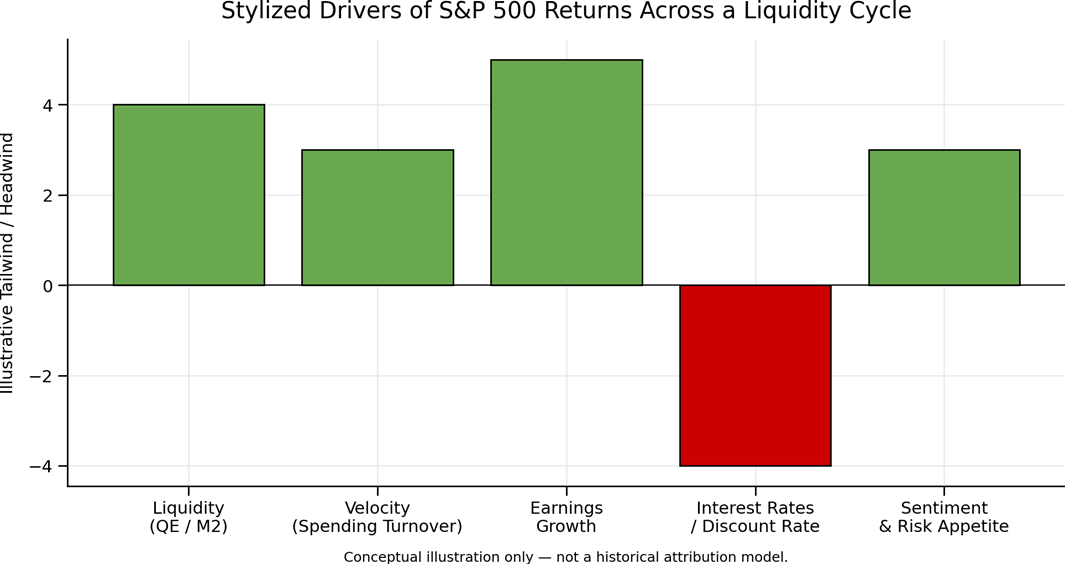
Figure 2: Stylized drivers of S&P 500 returns across a liquidity cycle. Conceptual illustration only — not a historical attribution model.
The S&P 500 Responds to Both Liquidity and Earnings
The S&P 500 is influenced by two broad forces: fundamentals and valuation. Fundamentals include revenues, profit margins, earnings and dividends. Valuation reflects the multiple investors are willing to pay for those earnings.
Liquidity affects both. When QE lowers bond yields, investors often become willing to pay more for future earnings. That supports valuation multiples. When M2 expands and velocity rises, nominal spending can increase, which may support revenues and earnings. When liquidity tightens, the opposite can happen discount rates rise, risk appetite weakens and valuation multiples may compress.
The relationship is not automatic, but the pattern is clear. Liquidity can be a major tailwind or headwind for broad equity returns.
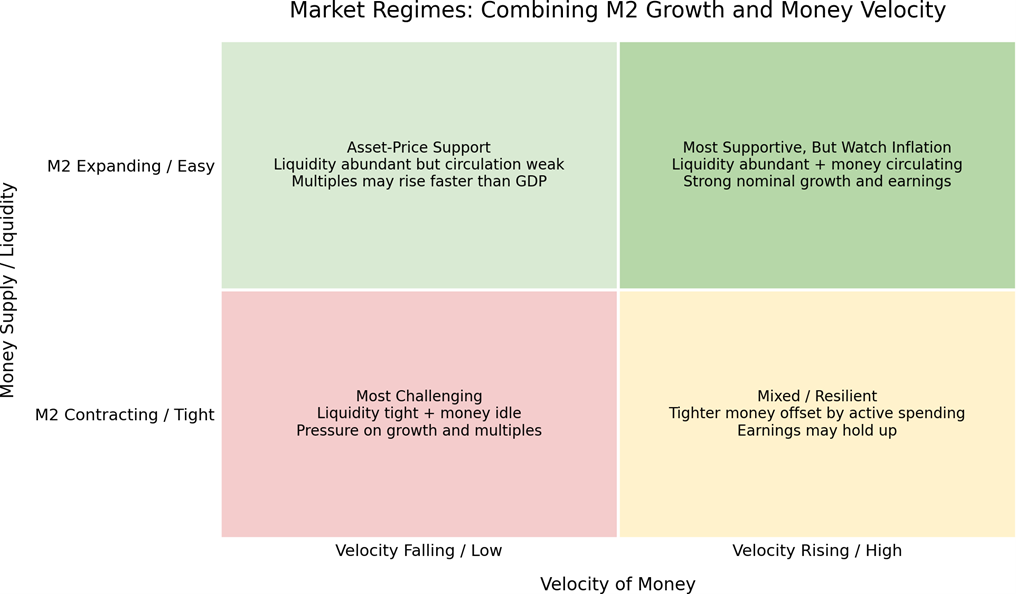
Figure 3: Market regimes combining M2 growth and money velocity. [7]
A Practical Market Regime Framework
M2 Expanding, Velocity Falling: This environment often supports financial assets more than real economic activity. Liquidity is abundant, but money is not circulating quickly. Investors may push into stocks and other risk assets because interest rates are low and alternatives are less attractive. This can lead to valuation multiple expansion.
M2 Expanding, Velocity Rising: This is generally the most powerful environment for nominal growth. Money is abundant and moving through the economy. Corporate revenues and earnings may improve. However, if inflation accelerates, interest rates may rise, which can eventually become a headwind for valuations.
M2 Contracting, Velocity Falling: This is usually the most difficult environment for risk assets. Liquidity is tightening and money is not circulating. Economic growth may slow, earnings expectations may weaken and valuation multiples may compress.
M2 Contracting, Velocity Rising: This is a mixed environment. Tighter liquidity may pressure financial assets, but rising velocity can keep nominal GDP and earnings more resilient. Markets may become more selective, rewarding companies with strong cash flows, pricing power and durable margins.
What This Means for Investors
Liquidity cycles matter. Markets tend to perform better when liquidity is expanding, financial conditions are easing and investors are encouraged to take risk. When liquidity contracts, return expectations should become more conservative.
Velocity determines whether liquidity reaches the real economy. If money supply expands but velocity remains low, the impact may show up more in asset prices than in GDP growth. If velocity rises, the impact can broaden into revenues, earnings and inflation.
Inflation changes the interpretation. Rising velocity can be positive when it reflects healthy economic activity. But if it contributes to excessive inflation, central banks may tighten policy. That can reverse the valuation benefit that liquidity initially created.
Valuation discipline matters more when liquidity slows. In a high-liquidity environment, markets often reward long-duration growth assets. In a tightening environment, investors tend to favour quality, cash flow, profitability, balance sheet strength and valuation discipline.[8]
Bottom Line
The link between M2, QE, money velocity and S&P 500 returns can be summarized simply: M2 tells us how much money exists. QE is one way central banks add liquidity. Velocity tells us how actively that money is moving through the economy. The S&P 500 responds to both liquidity-driven valuation changes and velocity-driven earnings growth.
When liquidity is abundant, rates are low and velocity is improving, the backdrop can be supportive for equities. When liquidity is contracting, velocity is falling and rates are rising, markets often face a more challenging environment.
For clients, the simplest framing is: money supply is the fuel, QE adds fuel, velocity determines how quickly the fuel moves through the economic engine, and the stock market responds to both the amount of fuel available and how productively that fuel is being used.
Reference
[1] Federal Reserve Bank of St. Louis, FRED, “M2 (M2SL).” https://fred.stlouisfed.org/series/M2SL
[2] Federal Reserve Board, Governor Michelle W. Bowman, “The Federal Reserve’s Balance Sheet as a Monetary Policy Tool: Past Lessons and Future Considerations,” May 28, 2024. https://www.federalreserve.gov/newsevents/speech/bowman20240528a.htm
[3] Federal Reserve Bank of New York, “Large-Scale Asset Purchases.” https://www.newyorkfed.org/markets/programs-archive/large-scale-asset-purchases
[4] Federal Reserve Bank of St. Louis, FRED, “Velocity of M2 Money Stock (M2V).” https://fred.stlouisfed.org/series/M2V
[5] Investopedia, “Understanding the Velocity of Money: Definition, Formula, Real-World Examples,” updated April 27, 2026. https://www.investopedia.com/terms/v/velocity.asp
[6] Federal Reserve Bank of St. Louis, FRED, “M2, Percent Change from Year Ago / H.6 Money Stock Measures.” https://fred.stlouisfed.org/graph/?g=1Di2X
[7] Federal Reserve Bank of St. Louis, FRED, “S&P 500 / M2.” https://fred.stlouisfed.org/graph/?g=JpB4
[8] Congressional Research Service, “The Federal Reserve’s Balance Sheet and Quantitative Easing,” June 28, 2022. https://www.congress.gov/crs_external_products/IF/PDF/IF12147/IF12147.1.pdf
AI, Market Hype, and Volatility: What It Means for Your Financial Journey | Written By Jordan Goh
Artificial intelligence is everywhere right now, from ChatGPT to Google Gemini to Claude, and it’s not just changing how we work, but how markets behave.
With so much attention around AI, many early investors and young professionals are starting to ask: “what does this actually mean for my investments?”
Applying Financial Principles to Market Trends
Understanding Market Sentiment
The recent surge in AI-related stocks is a strong example of how sentiment drives markets. Investor excitement around future potential has pushed prices higher, sometimes ahead of actual earnings or profitability.
This is a reminder that markets don’t move purely on fundamentals in the short term. Emotions, expectations, and narratives can all influence pricing. Recognizing this helps investors stay grounded during periods of rapid growth or sudden pullbacks.
The Risk of Chasing Momentum
When a sector becomes popular, it’s natural to feel like you’re missing out. However, investing based on momentum alone can expose you to unnecessary risk, especially if valuations are driven more by optimism than by actual financial performance.
This is where discipline matters. Rather than chasing what’s trending, strong investors focus on whether a company’s fundamentals support its price.
Diversification as a Risk Management Tool
The increasing concentration of the tech sector, now making up a significant portion of major indices, means portfolios can become more exposed to a single theme without realizing it.
Diversification helps manage this risk. By spreading investments across sectors and asset classes, you reduce the impact of any one area experiencing volatility.
This principle becomes especially important during periods of innovation-driven growth, where certain sectors can dominate headlines, and portfolios.
Volatility Is Part of the Journey
Periods of rapid innovation, like what we’re seeing with AI, often come with increased volatility. Prices can rise quickly, but they can also correct just as fast if expectations shift.
Rather than viewing volatility as something to avoid, it’s more useful to understand it as a natural part of investing. Having a plan in place allows you to navigate these movements with confidence instead of reacting emotionally.
Planning Through Innovation Cycles
Major technological shifts have always influenced markets, from the internet boom to today’s AI expansion. While the opportunities can be significant, long-term success comes from staying focused on your broader financial plan.
Ask yourself:
- Does this investment align with my long-term goals?
- Am I properly diversified?
- Am I investing based on research, or reacting to headlines?
These are the same questions that guide all sound financial decisions, regardless of the trend.
Your Financial Journey Starts Here
AI is a powerful force shaping today’s markets, but it’s only one piece of the broader investment landscape.
I’ve created a video that explores how AI is contributing to market volatility and what that means for investors. Use it as a tool to better understand not just this trend, but how to approach future ones with clarity and discipline.
The key takeaway: innovation creates opportunity, but successful investing still comes down to fundamentals; research, diversification, and a well-defined plan.
References:
U.S. Tech Stock Volatility and the AI Bubble: Navigating the Hype and the Hurdles
Lifestyle Creep: The Raise That Made You Poorer | Written By Dylan Farrago
You got a raise. Congratulations. Now ask yourself, where did the last one go?
If you can't quite remember, you're not alone. Most people feel richer for about three months after a raise, and then it disappears into bigger rent, a nicer car, a few more streaming services, and a couple of dinners out that used to feel like a treat. The paycheque went up, but the bank account didn't. That's lifestyle creep, and it might be the single biggest reason that high earners still feel illiquid later in life.
What Is Lifestyle Creep?
Lifestyle creep is the slow, almost invisible rise in spending that happens alongside a rise in income. Every individual upgrade feels earned, and honestly, most of them are. You worked hard. You deserve the better apartment, the nicer vacation, the upgraded phone. The problem isn't any single decision, it's the cumulative drift. Five years of small upgrades later, your savings rate looks suspiciously like it did when you were making half as much money.
The really uncomfortable part is that lifestyle creep doesn't discriminate based on income. The doctor making $400,000 a year can feel just as financially squeezed as the teacher making $70,000, because their fixed costs have crept up to swallow the difference.
Statistics Canada's Survey of Household Spending confirms what the math suggests: as Canadian household incomes rise, total spending rises with them, and the savings gap doesn't widen nearly as much as people assume.
Why It Happens
Lifestyle creep isn't a willpower problem. It's a wiring problem.
There are at least four forces working against you, and most of them operate below the level of conscious thought.
1. The Shine Wears Off
Your brain treats new luxuries as the new baseline almost immediately.
The car that felt amazing in the first month becomes "just my car" by month four. The kitchen renovation that felt life-changing becomes invisible by the time the next season rolls around. This is one of the most well-documented findings in behavioral psychology. A famous 1978 study by Brickman, Coates, and Janoff-Bulman found that even lottery winners returned to roughly their original level of happiness within a year of winning. The joy from any upgrade is real, but it has a short shelf life, and chasing it costs more money every cycle.
2. Social Comparison
As your income grows, your circle often grows with it. New job, new neighbourhood, new peer group. Suddenly the friends you're surrounded by are renovating kitchens and booking trips to Europe, and what felt like "enough" last year starts to feel like falling behind. Economists Marianne Bertrand and Adair Morse, in a 2016 study published in the Quarterly Journal of Economics, found that middle-income households measurably increase their spending when wealthier households in their region spend more. The trap is that you rarely see anyone's full balance sheet. You see the trips, the car, the cottage. You don't see the line of credit funding it. You end up comparing your reality to someone else's highlight reel, and quietly adjusting your spending to match.
3. Identity Creep
This is the sneakiest one. Once you start buying a certain kind of coffee, wearing a certain brand, or driving a certain car, your brain starts to attach those choices to your identity. Downgrading doesn't just feel cheaper, it feels like a downgrade of you. So even when finances tighten, the lattes stay, the brand stays, the lease gets renewed. Cutting back doesn't register as smart, it registers as a step backward.
4. The "I Earned This" Permission Slip
Every raise comes with a built-in justification for spending more. You worked harder, took on more responsibility, finally got recognized. Of course you should treat yourself. The problem isn't the treat, it's the size of it. A celebratory dinner is a treat. Trading up to a new car, a bigger mortgage, and a beach vacation all in the same year because the bonus came in is not a treat, it's a permanent raise in your cost of living. And once those fixed costs are in, they are very, very hard to walk back.
The combined effect of these four forces is that your financial baseline drifts upward almost automatically, while your savings rate stays exactly where it was. This isn't about deprivation. It's about awareness. You can't fix a problem you can't see.
The Real Cost: Two Side-by-Side Savers
Let's put some numbers on it. Imagine two people, both 30 years old, both earning $100,000, both getting 3% annual raises, and both earning 6% on their investments until age 65.
Person A saves 10% of their starting salary, $10,000 a year, and never changes it. They got raises every year, but those raises went straight into their lifestyle.
Person B also saves 10%, but they bump up their contribution every time they get a raise. Same percentage, just applied to a growing paycheque.
Here's where it lands at age 65: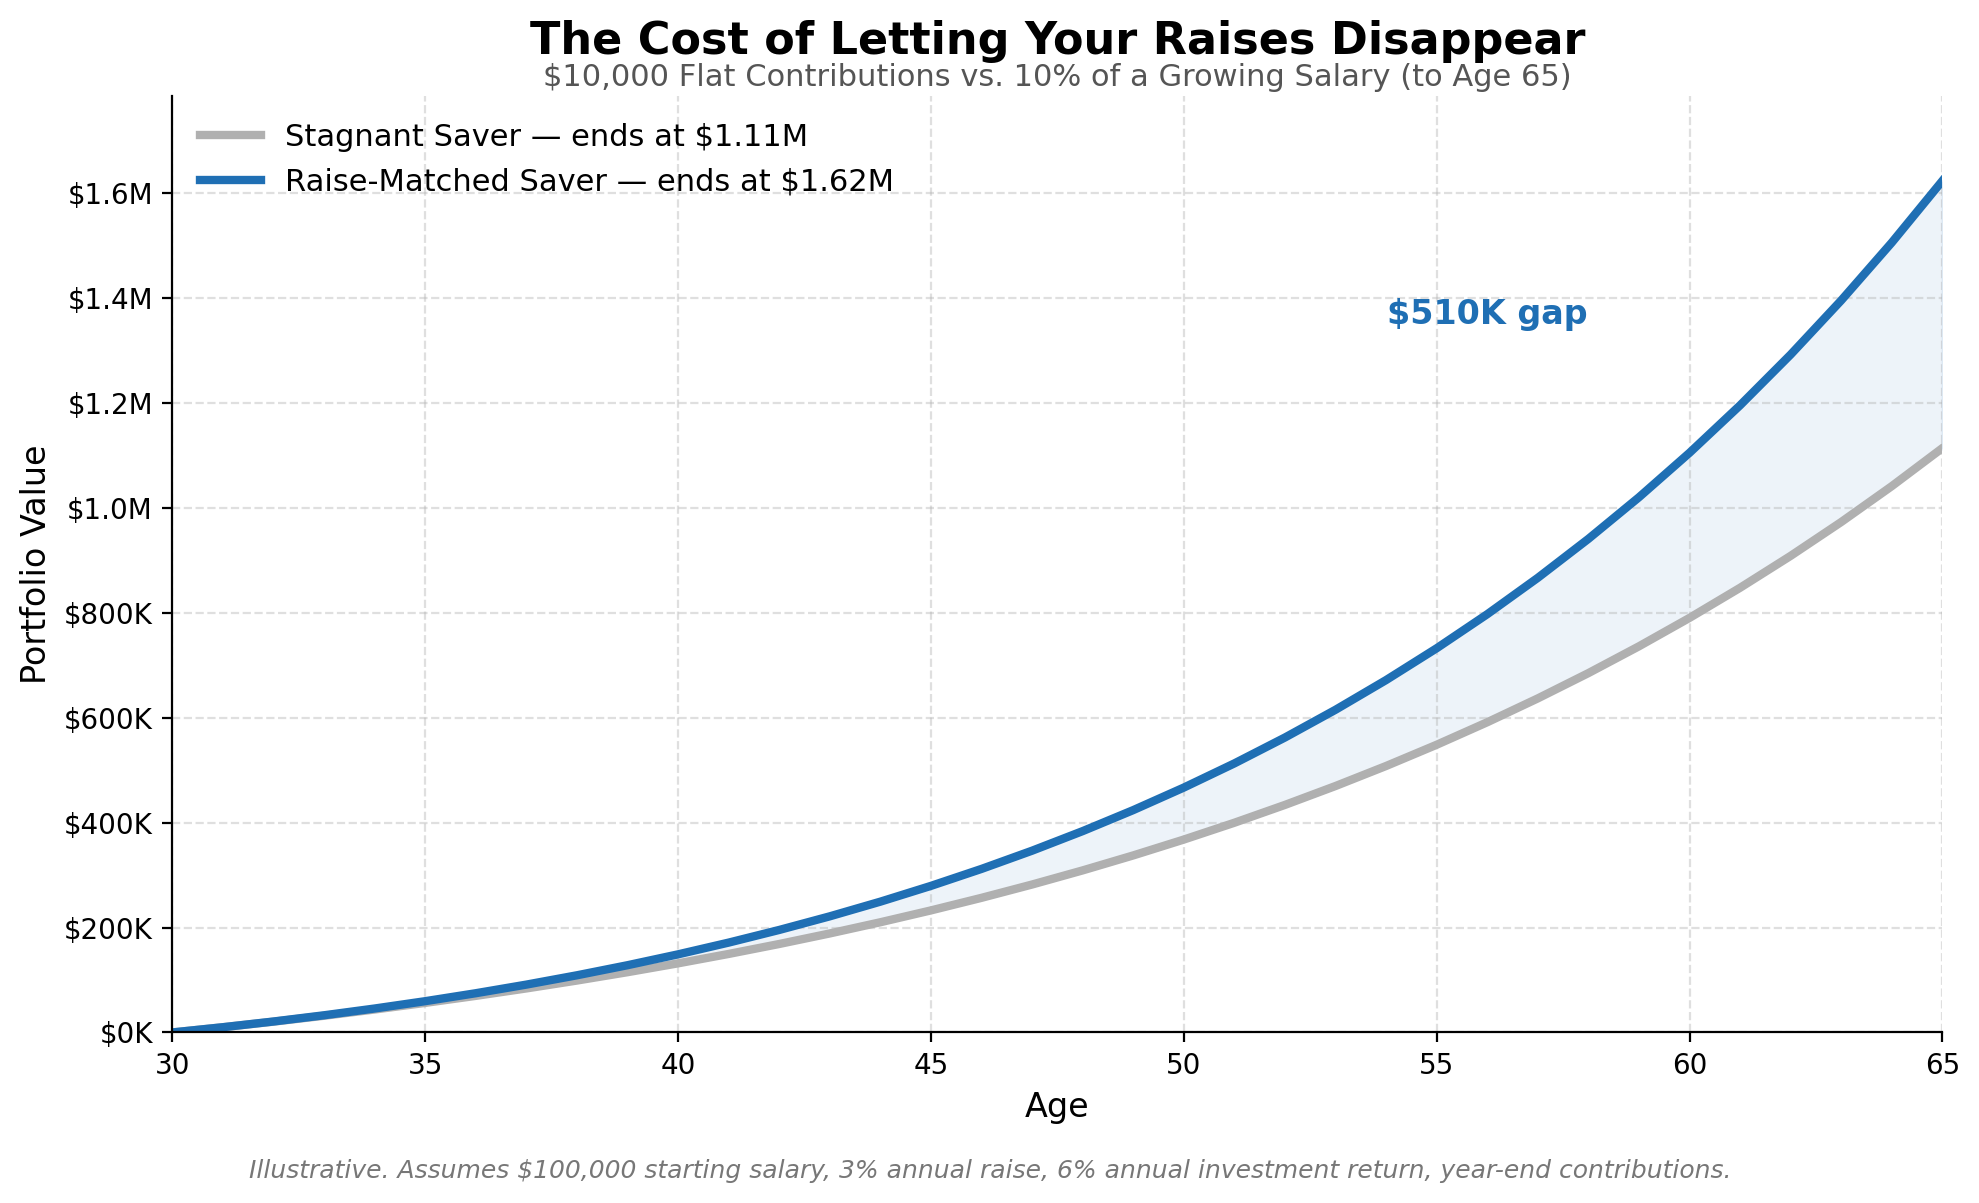
Person A: roughly $1.11M
Person B: roughly $1.62M
Same income. Same return. Same starting savings rate. Person B ends up with roughly $510,000 more, and they never once felt like they were sacrificing, because their savings grew at exactly the same pace their lifestyle did. Half a million dollars in retirement money, gained or lost, just from how each one of them chose to handle their raises. This is just an illustration, and real life differs in many ways. It is meant to convey the compounding nature of your decisions over time.
Three Practical Moves
You don't need a budget app or a spreadsheet to fight this. You need a few habits.
Bank Half Your Raise
The next time you get a raise, automate 50% of it straight into your TFSA or RRSP before your lifestyle has a chance to expand. You still get to enjoy half of every raise, and your future self gets the other half. The reason this works is that you never see the money in your day-to-day account, so it never becomes part of your baseline in the first place.
Audit Your Subscriptions Quarterly
Recurring charges are creep's favorite hiding spot. Streaming services, app subscriptions, gym memberships, software trials that quietly converted to paid. Once every three months, pull up your credit card statement and cancel anything you haven't actively used in the last month. Most people find $50 to $150 a month they didn't even realize they were spending.
Set a Lifestyle Ceiling
Decide in advance which luxuries are actually worth it for you, and which ones just look good on paper. Spend, without guilt, on the things that genuinely make your life better. Cut the rest. The point isn't to live small, it's to live deliberately. The person who spends
$150 a month on great coffee because they love it, and drives a 10-year-old car because they don't care about cars, is going to end up wealthier and happier than the person who buys both because that's what people at their income are "supposed" to do.
The Bigger Picture
Lifestyle creep doesn't feel like a problem until it's the reason you can't retire on time. The fix isn't saying no to enjoyment, it's making sure that today's comfort isn't quietly borrowing from tomorrow's freedom.
A raise is supposed to make you wealthier. Make sure it actually does.
References:
- Brickman, Coates & Janoff-Bulman, "Lottery Winners and Accident Victims: Is Happiness Relative?" Journal of Personality and Social Psychology (1978); Bertrand & Morse, "Trickle-Down Consumption," Quarterly Journal of Economics (2016); C+R Research, Subscription Service Statistics and Costs (2022); Statistics Canada, Survey of Household Spending.
Happenings
Christine
Kase finished his first full season of hockey. Where not only is he joining the game 5-7 years later than everyone else, he decided to be a goalie. I guess he liked it as he is going back next year. Christine plans to write a psychological piece on how being a goalie is like advising clients on investing during turbulent markets. For now, here is the starting line for a gold medal game at their final tournament. Standing there with peers, lined up for the singing of Oh Canada, is something I am sure he will never forget.

Ryan
The Lidder household was busy in March as both the girls celebrated their 2nd and 4th birthday. As the saying goes, the days are long but the years are short.

There will be no large vacation in the Lidder household this year as they are currently mini van shopping as they get closer to the expected arrival of their 3rd child in June. Ryan is set out to make Van’s cool so be sure to ask him about all the features.
Jordan
Jordan visited Hawaii in February and it did exactly what it was supposed to: slow things down for a bit. Pictured here with shave ice in hand, fully leaning into the break.
This was not the first of the trip... and definitely not the last.

Dylan
This spring, Dylan laced up for the BMO Vancouver Half Marathon and shaved an impressive 5.5 minutes off his personal best. With two half marathons now under his belt, Dylan has his sights set on the full BMO Marathon in spring 2027. He might have caught the exercise bug as he will be competing in Hyrox Vancouver in December and will look to start training for his first triathlon.

Dylan also spent part of the spring volunteering with Junior Achievement (JA), a program that brings professionals into elementary schools to teach kids the basics of money, business, and entrepreneurship. Over four one-hour sessions at the G.T. Cunningham Elementary School in Vancouver, he worked with a group of fifth-graders to explore their passions and ambitions. "It was honestly one of the most rewarding things I've done all year. These kids were way more interested in this information than I was back then and asked really good questions," Dylan said. He stuck to the JA curriculum for most of the sessions, but admitted to going slightly off-script in the final 10 minutes to introduce the class to the wonders of the TFSA. "Never too early to start planting that seed."

Musings from The Team
Christine
“If you don’t read the newspaper you’re uninformed. If you read the newspaper you’re misinformed.”
– Mark Twain
Ryan
“The stock market is a device for transferring money from the impatient to the patient.”
– Warren Buffett
Jordan
“The investor’s chief problem—and even their worst enemy—is likely to be themselves.”
– Benjamin Graham
Dylan
“Patience is not the ability to wait, but the ability to keep a good attitude while waiting.”
– Joyce Meyer