August Market Recap
Ashley Nichols - Sep 18, 2026
August had some surprises for investors. Despite trade and tariff tensions, debts and an unsure bond market, corporate earnings were strong. Stephen shares insights on market conditions, along with our performance numbers and more!

Money is a Tool. It's something that supports your life!
Portfolio Management Comment
Brent Joyce CFA;
Chief Investment Strategist and Managing Director, BMO Private Wealth
Sensational and Sensationalism
“The one function that TV news performs very well is that, when there is no news, we give it to you with the same emphasis as if it were.”
– David Brinkley,
1920–2003, American television news anchor
August was a sensational month. In fact, sensational has two main meanings: exceedingly good (not the usage we mean for the progress of Canada-U.S. trade talks) and sensationalized, or presenting information in a way intended to provoke hyped-up public interest, excitement or concern (that’s the one that applies to media coverage of the tariff “wars”). Both usages of sensational apply to the events of August.
Thankfully, the exceedingly good events were the ones that moved markets. It was an outcome
many found surprising and hard to understand – and, as Canadians, perhaps even a bit guilt-inducing. (What? My neighbour could be laid off because of AI or the trade war, yet I made money in stocks – even my Canadian ones?)
Still (and always) it’s all about earnings
The most significant element for equity investors is earnings growth, which was nothing short of
sensational/spectacular. Earnings growth for the S&P/TSX topped 35%; nine of 11 sectors posted positive results, and six logged growth north of 20%. For the S&P 500, earnings grew by over 52%, more than double analysts’ expectations. Healthcare was the only sector that contracted; seven sectors chalked up growth of over 20%. Japan’s Nikkei Index saw earnings growth of
nearly 70%. Every sector posted positive results; all except three eclipsed 20%, six topped 50%. The list goes on and on. Europe and Mexico posted 15% growth; Australia is tracking toward 50% growth.
Undeniable broadening
These lofty numbers tend to make everyone double-check their math. They are also the kinds of numbers that aren’t driven solely by AI spending. Yes, AI investment continues to be a
factor. Data-centre construction, software spending and infrastructure investment remain powerful drivers of economic growth in both the U.S. and, increasingly, in Canada. Earnings also show evidence of productivity gains from AI adoption.
The broad-based nature of the growth can’t be explained by this one theme alone. We have cited the many factors driving nominal economic activity (real activity plus inflation). August saw many of them: corporate resilience, adaptability, solid balance sheets, tariff rebates and a recovery in global manufacturing. Globally, purchasing managers’ indexes for manufacturing activity (PMIs) are solid and rising, which supports the view that the global industrial cycle is improving. In the U.S., the ISM PMI reached its highest level since 2022; eurozone manufacturing PMIs
climbed to multi-year highs.
In the U.S., credit conditions and loan demand improved, including for commercial real estate.
Japan’s structural story remains positive. Corporate reforms, stronger growth and further policy
normalization continued to support long-term investor interest.
Oh Canada
Canadian economic data also surprised to the upside. Employment rose by 75,000, unemployment fell to 6.4% and retail spending remained resilient.
The current account balance rocketed out of negative territory for the first time in three and a half years, reaching its highest level in two decades. Canadian GDP rebounded sharply in Q2, posting a solid 3.3% annualized advance. The first quarter was revised up from a small negative to a small positive – exorcising the technical recession. Net exports were bolstered by auto production. Consumption growth was the strongest in a year, and business investment – a prerequisite for productivity growth – jumped 12.3%. Even residential investment turned positive, rising 10.4%.
Main Street also shared in the wealth: household income rose solidly (+8.7% annualized) and pushed the savings rate up 0.4% to 3.7% (prudent for any rainy days that might lie ahead).
Sensationalism
We could stop this commentary here and risk being called naïve or Pollyannish. The rest of our discussion concerns the other definition of sensational: negative headlines that provoked public
interest and concern but, when put into context, weren’t all that sensational.
The media – a business very much in flux and under disruption – prey on greed and fear; when fear is present, it is the go-to emotion for attracting an audience. August featured three events that could be presented as though the sky is falling.
Yearning for the yen
The U.S. Treasury Department and the Federal Reserve coordinated with Japanese authorities to intervene in currency markets and strengthen the yen. Coordinated currency interventions are rare and usually reserved for times of financial crisis, war or natural disaster. None of these currently plague the Japanese economy, so the intervention is curious.
$40 trillion
Next, the U.S. debt crested $40 trillion for the first time ever. It is a large and worrisome number, yet so was $39 trillion. This milestone was no surprise, so why all the fuss? Simply because it reached a whole round number is no reason to change your investment strategy.
We could say a lot on this topic, none of it good. It is worth noting, however, that huge numbers are everywhere. Single companies are worth trillions (15 at last count, totalling over $30
trillion), and AI spending is estimated to top trillions. When you hear a large number, it needs to be put into context. Over the last 10 years, U.S. debt climbed from around $20 trillion to $40 trillion. U.S. household net worth rose from approximately $80 trillion to about $174 trillion. American households gained nearly $95 trillion in wealth, more than twice the increase in federal
debt. This doesn’t make the debt problem any better; what it does tell you is that America is a wealthy place. For now, if the choice is to mortgage future generations for the benefit of today then the world has no reason to stop lending Uncle Sam money.
“Oh, the price is actually the problem,” some say. Bond yields in the 5% neighbourhood aren’t a crisis – going back decades, 5% is normal. The 50-year average for 30-year U.S. Treasury yields is over 6%. In turn, the U.S. debt service as a percentage of GDP is elevated, although not into uncharted territory.
Debt binge
Debt isn’t just a U.S. story. Governments the world over are borrowing as though money were still free. We can look at these elevated bond yields in another way: higher yields better compensate investors for the risks we outlined above, while higher borrowing costs are the best way to get governments to spend less. It is also better for bond yields to rise now, when the economy is doing well (which is also part of the reason yields are elevated). We should thank the sensationalists for bringing debt and deficits to the forefront; we just shouldn’t overreact to
them in our investment decisions.
Treasury tinkering
Lastly, and related to the former point, the U.S. Treasury announced that it will tailor its bond issuance and buybacks. Delving into the minutiae here is laborious; nevertheless, two things
deserve a mention. First, some will portray this as a deep-state conspiracy in which the government is manipulating the bond market to avoid the crushing weight of the debt. Second, the Treasury’s actions may ease financial conditions, potentially reducing upward pressure on bond yields.
Our take is that Treasury buybacks can temporarily calm bond markets, yet they do not eliminate the structural challenges posed by deficits, inflation and long-term funding needs. This is precisely the outcome so far. Long-dated bond yields did fall in the days immediately following the announcement, but by month end had risen again as the structural challenges remain.
The main impact for market participants is a blurring of the lines between fiscal and monetary policy at a time when new Fed Chair Kevin Warsh isn’t saying much. He did, however, recently tell the world that a bond market devoid of manipulation is the best arbiter of bond yields. These mixed messages from the Fed and the Treasury Department leave investors wondering what’s next.
Don’t believe it? Well, the markets do
To those who call us sensational or too Pollyannish, we simply point to the best barometer we know: the markets themselves. Global stocks rose for the month. The S&P/TSX was among the top performers, posting a 2.7% gain. Some of those gains – including a new all-time high – came after trade talks broke down. The Canadian dollar did weaken on the trade news; nevertheless, earlier gains helped the loonie finish the month stronger.
The S&P 500 gained 2.5%, international developed markets (EAFE) rose 2.2% and emerging markets gained 3.4%.
U.S. de-dollarization was another theme that emerged because of all three highlighted events in August. Yes, the greenback declined against many other currencies, but it had rallied earlier in the summer. The fact that an asset price can move in both directions doesn’t mean it is in freefall. The U.S. Dollar Index ended August down 0.5% for the month.
What about the bond market? Wasn’t everyone up in arms about rising bond yields? Long-term U.S. Treasury yields ended the month little changed from the end of July. Of course, the doomsayers will argue that happened only because the Treasury Department announced intervention in the bond market.
Canadian bond yields rose by roughly 10 basis points across most maturities, sending the FTSE Universe Bond Index down 0.24% for the month. Mildly bruised bond investors should take comfort in the fact that the higher yields are largely being driven by evidence of a stronger Canadian economy.
Bottom line
The sensations of the month were improving manufacturing activity, broadening earnings growth, resilient Canadian economic data, easing fears of Fed rate hikes, stronger credit conditions and ongoing AI investment.
Rising global bond yields, growing fiscal concerns, elevated energy prices and renewed Canada-U.S. trade tensions, while important developments, weren’t the showstoppers that the sensationalist media made them out to be.
Once again, August brought challenges. Once again, stocks and the economy remained surprisingly resilient.
Asset mix considerations – favour risk assets, fixed income is becoming more attractive
We continue to prefer equities over fixed income. But as bond yields rise, fixed income grows more attractive.
We also continue to favour overweight positions to Canadian and U.S. equities. Canadian equities offer exposure to resources, financials and energy; U.S. equities provide access to the world’s most dynamic technology leaders.
On international markets, we hold a neutral view. They offer improving manufacturing momentum, though growth remains uneven.
For client risk profiles that include exposure to emerging markets, we are constructive. These equities can benefit from a softer U.S. dollar and an AI-related trade.
Within fixed income, higher yields have improved prospective returns. We see corporate bonds as attractive given the solid profit backdrop.
The last word: Keep emotions out of your portfolio
The trade news is monopolizing the public conversation in Canada. We do not want to minimize the impact on targeted industries and their communities. Then again, context is relevant and
significant here.
BMO Economics estimates that approximately 5% of Canadian exports are affected and roughly 0.8% of GDP is exposed. That means 99.2% of the economy is not exposed.
The tariffs could shave approximately half a percentage point off GDP growth. On the other hand, growth is showing signs of strength. We enter this new phase on a decent footing, which includes the fiscal room to shelter affected workers and businesses.
For the Canadian stock market, the impact is even smaller, as demonstrated by its strength after the trade talks broke down. Remember that the Canadian economy is not the Canadian stock
market, which is heavily weighted toward financial services, energy, and materials companies. These businesses face little to no tariff impact. Even though forestry products, cars, auto parts, dairy and consumer electronics have a footprint in the Canadian economy, the companies in these industries make up less than 10% of the stock market index.
Investment decisions must be as rational and dispassionate as possible. Unfortunately, when we are faced with fear or uncertainty stoked by sensationalist rhetoric, our fight-or-flight instincts
can lead to emotional decisions that risk knocking us off course so that we aren’t able to achieve our long-term investment goals. Even the seasoned journalist David Brinkley acknowledged that the news leans toward the negative and sensational. The exceedingly positive events in August outweighed the negatives, and markets climbed higher. Take that as your cue to stay calm in the face of uncertainty.
Our Portfolio Management Approach
We hope you have been listening and enjoying our podcasts. If you have any financial or investment questions you'd like us to cover, please email Ashley at ashley.nichols@nbpcd.com.
We are fundamental investors that use technical analysis to manage short-term market risks. We believe that risk management is not a choice, but a necessity. While we cannot control how much downside the market provides during a correction, we can control how much of the downside your account receives. We aim to avoid 60% or more of the decline in any significant downturn. Without our process, there is a good chance you will experience 100% of the downside from the market. We will help you navigate the risks and rewards of the market so that you can stop worrying about your money and start living your life.
Transactions
The following is a chronological list of the trades:
We had purchased a 5% tactical trading position in the BMO S&P 500 hedged to CAD at 99.418 and sold it at $103.716 when it hit out technical target.
We trimmed the Royal Bank, Manulife and National Bank.
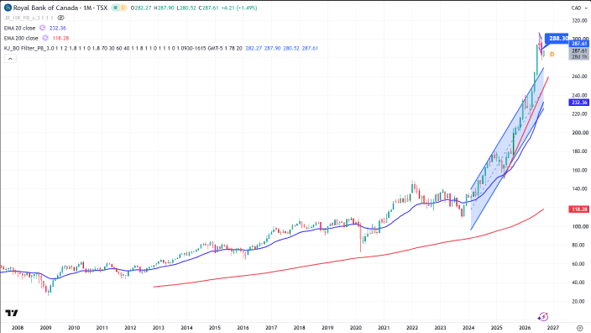
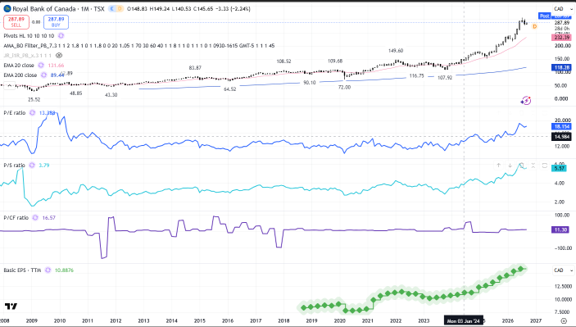
Earnings were expected to be outstanding and they were, but they are all very extended technically and are at all time high valuations. It’s hard to argue that the good news isn’t already priced in.
You can see in the following chart how far the Royal has moved over the last year.
The following chart shows the underlying valuations. You can see that the Royal was trading around 13x earning from 2010 till 2025, never exceeding 14X, today its over 18X.
We added a 5% trading position in Nasdaq via the ZQQ etf at $198.805.
We are looking to add to positions during the historically weak September month especially before the US Mid Term elections.
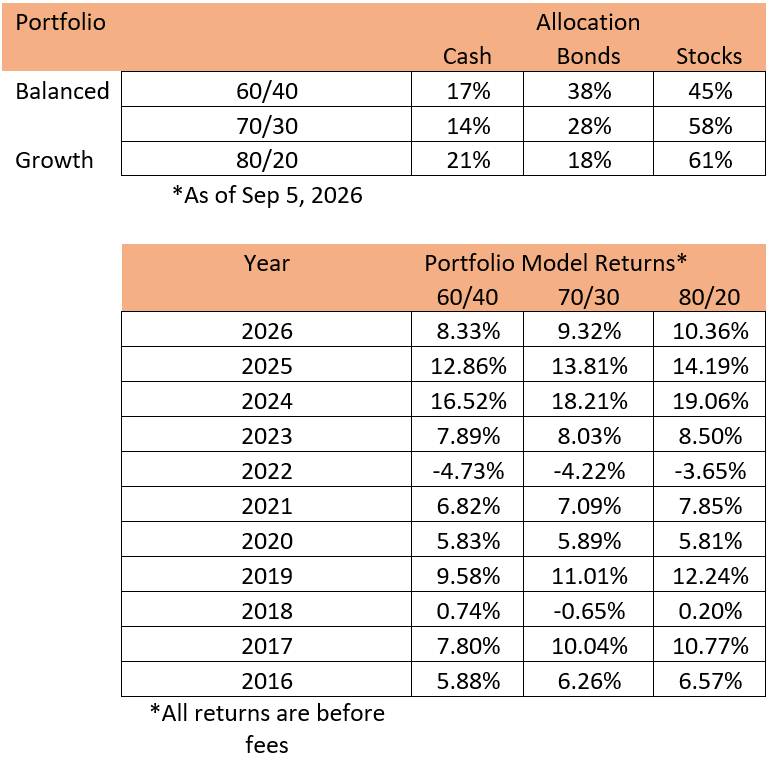
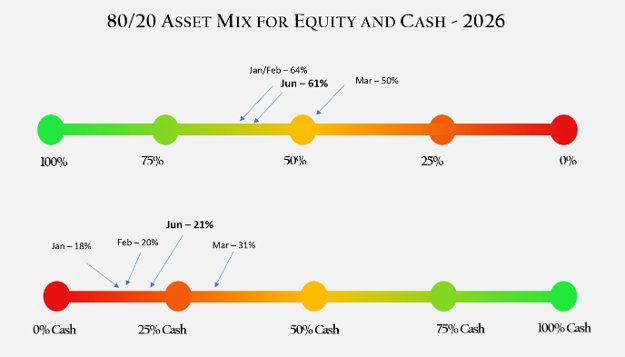
Returns on our 60/40, 70/30 & 80/20 portfolios, before fees
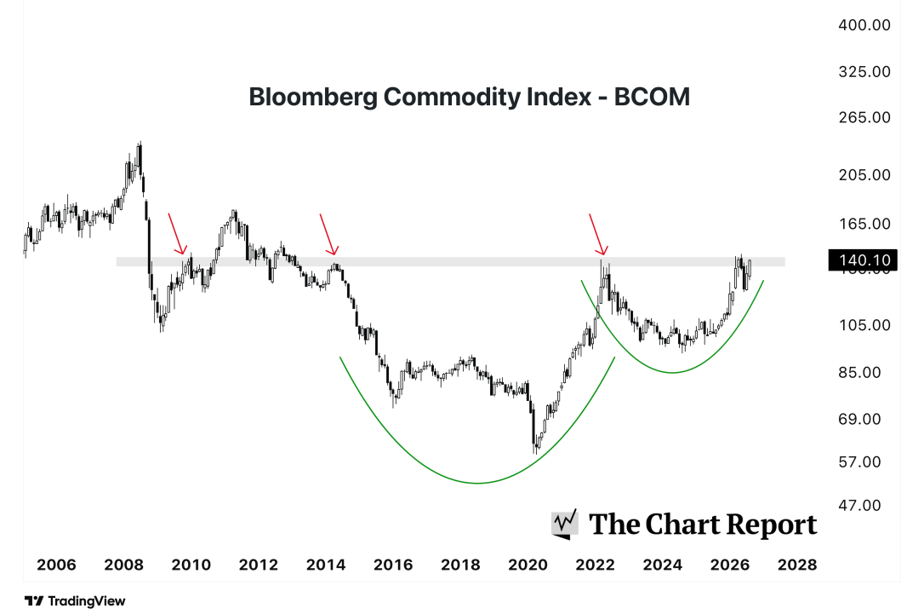
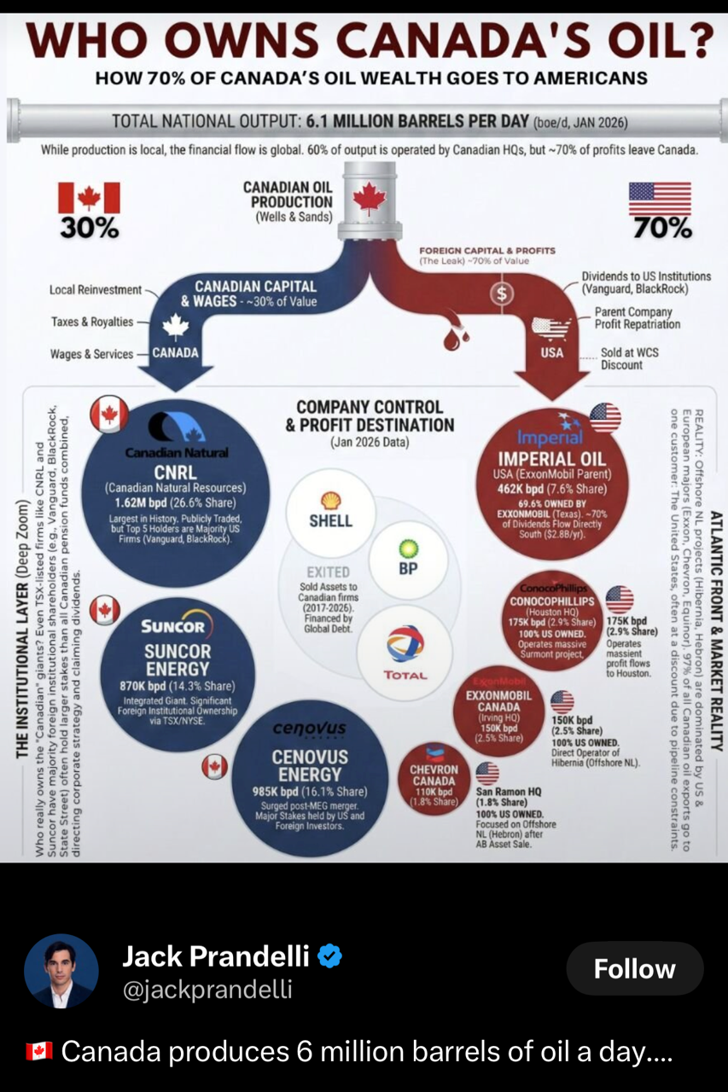
Interesting Charts
Technical Comment
E-mini Breakout Above the Possible Final Flag | Brooks Trading Course
Market Overview: S&P 500 E-mini Futures
The S&P 500 E-mini breakout above the possible final flag on the monthly chart. Bears see the sideways trading range (May to July) as potentially the final flag of the move. Bulls need to create strong follow-through buying to increase the odds of a successful breakout above the bull flag.
The Monthly E-mini chart
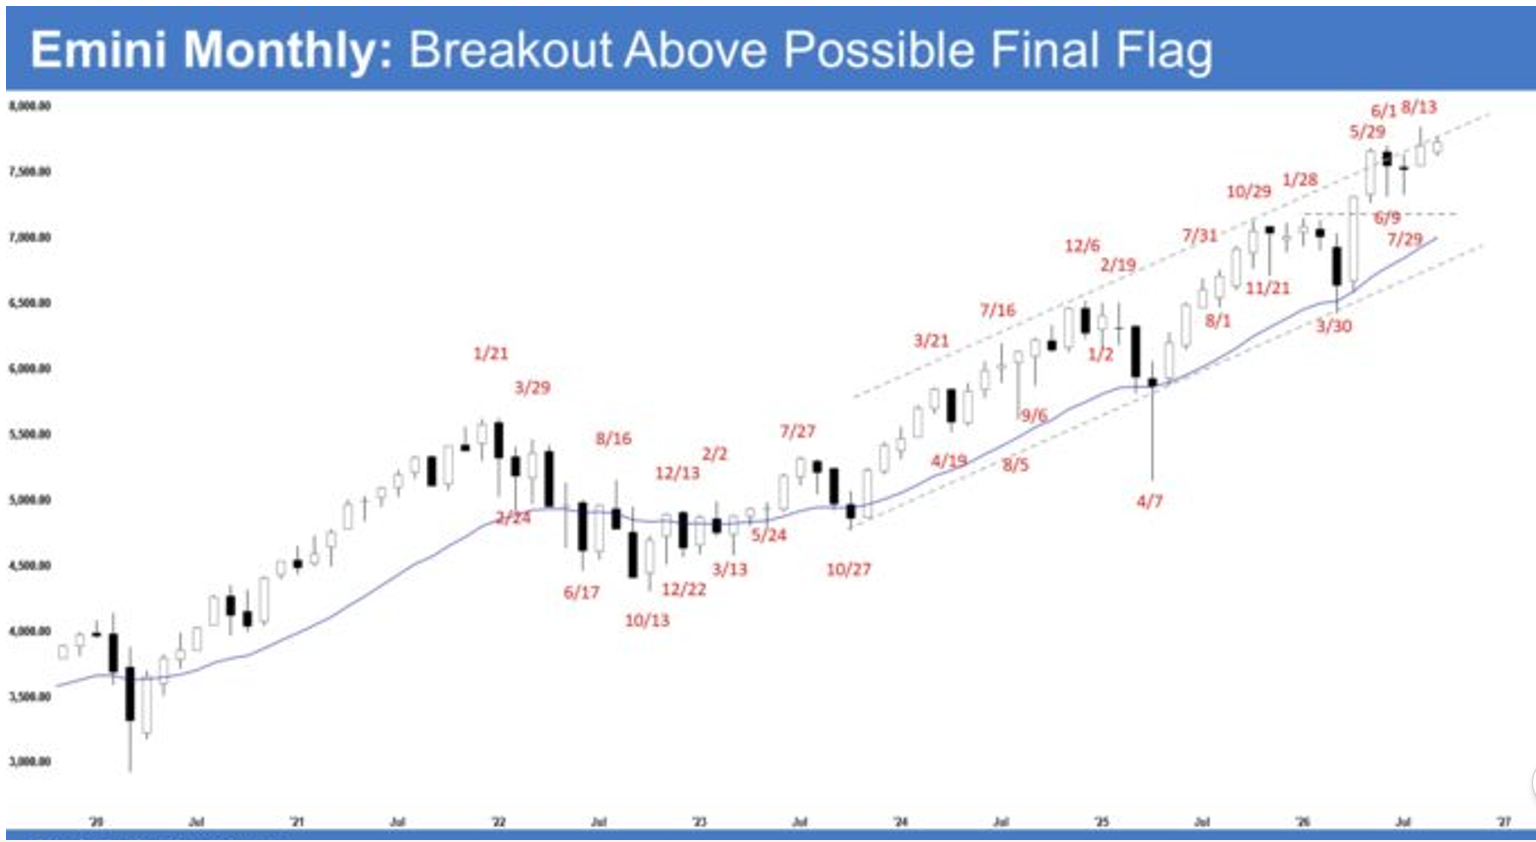
o August was a bull bar closing around the middle of its range with a prominent upper tail.
o Last month, we said traders would watch whether bulls could break above the sideways trading range toward the 8000 measured move target and, if they did, whether the breakout bar would be strong or close with a long upper tail or a bear body instead.
o Bulls want a measured move to around 8000 based on the height of the April spike bar.
o Bulls see the 3-month sideways trading range (May to July) as a bull flag and want a measured move based on its height, which will also take the market to around the 8000 area.
o Bulls need to create strong follow-through buying to increase the odds of a successful breakout above the bull flag.
o If the market trades lower, bulls hope the middle of the sideways trading range or the June 9 low area will act as support.
o Bears see the sideways trading range (May to July) as potentially the final flag of the move.
o Bears want a failed breakout followed by a test of the final flag low (June 9).
o Bears want a reversal from a large wedge top (December 6, October 29, and August 13).
o Bears hope any move higher will lack follow-through buying, forming prominent upper tails or bear bodies.
o Bears need to create strong bear bars to indicate strength. Without that, traders will be reluctant to sell aggressively.
o The market broke above the sideways trading range in August, which could potentially be the final flag of the move.
o The prominent upper tail indicates weakness and that the bulls are not yet as strong as they had hoped.
o Traders will watch whether bulls can create follow-through buying toward the 8000 measured move target.
o Or whether the market will stall around the current area, forming candlesticks with prominent upper tails or bear bodies instead.
o Until the bears can create consecutive strong bear bars to flip the market into Always In Short, traders will be reluctant to sell aggressively.
Millennial Minute
So, you opened an RESP for your kids or grandkids, they’ve gone and finished their
schooling and have begun embarking on their journey through adulthood.
Now, however, you’re stuck with an account that still has funds in it, and you’re
not sure what to do with it.
Youcan read this month’s article and see what the steps are to empty and close out
any RESP account you might be thinking of closing down.
Planning Article
Options for Unused RESP Savings
When your child's plans have changed regarding post-secondary, it's handy to know your options when it comes to the RESP you've contributed to for their future. RESP funds are separated into different categories of what can and cannot be withdrawn, and it's always bets to know your options.


DISCLAIMER:
The opinions, estimates and projections contained herein are those of the author as of the date hereof and are subject to change without notice and may not reflect those of BMO Nesbitt Burns Inc. (\"BMO NBI\"). Every effort has been made to ensure that the contents have been compiled or derived from sources believed to be reliable and contain information and opinions that are accurate and complete. Information may be available to BMO NBI or its affiliates that is not reflected herein. However, neither the author nor BMO NBI makes any representation or warranty, express or implied, in respect thereof, takes any responsibility for any errors or omissions which may be contained herein or accepts any liability whatsoever for any loss arising from any use of or reliance on this report or its contents. This report is not to be construed as an offer to sell or a solicitation for or an offer to buy any securities. BMO NBI, its affiliates and/or their respective officers, directors or employees may from time to time acquire, hold or sell securities mentioned herein as principal or agent. BMO NBI -will buy from or sell to customers securities of issuers mentioned herein on a principal basis. BMO NBI, its affiliates, officers, directors or employees may have a long or short position in the securities discussed herein, related securities or in options, futures or other derivative instruments based thereon. BMO NBI or its affiliates may act as financial advisor and/or underwriter for the issuers mentioned herein and may receive remuneration for same. A significant lending relationship may exist between Bank of Montreal, or its affiliates, and certain of the issuers mentioned herein. BMO NBI is a wholly owned subsidiary of Bank of Montreal. Any U.S. person wishing to effect transactions in any security discussed herein should do so through BMO Nesbitt Burns Corp. Member-Canadian Investor Protection Fund.
BMO (M-bar roundel symbol)” is a registered trademark of Bank of Montreal, used under licence.