March Market Update
Ashley Nichols - Apr 17, 2026
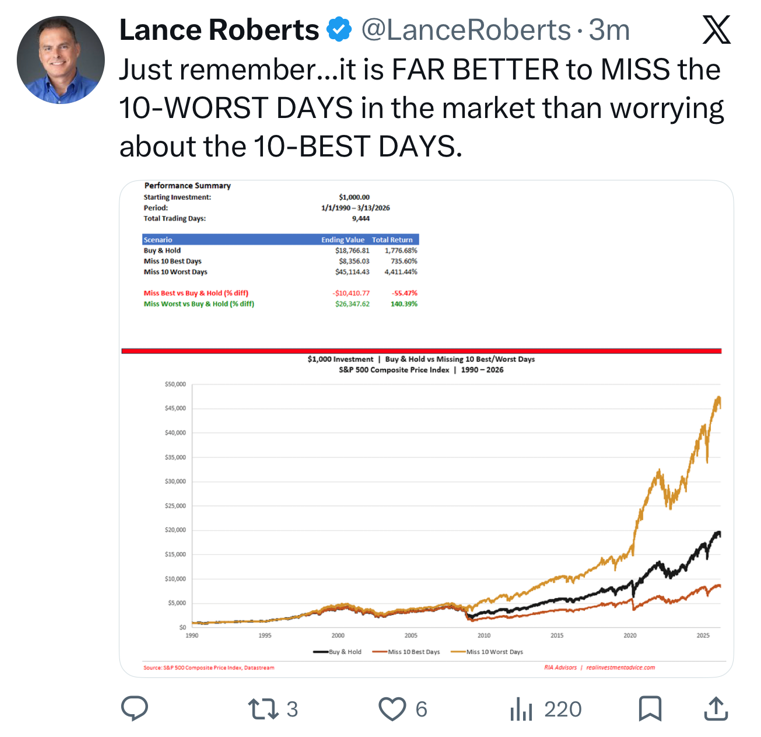
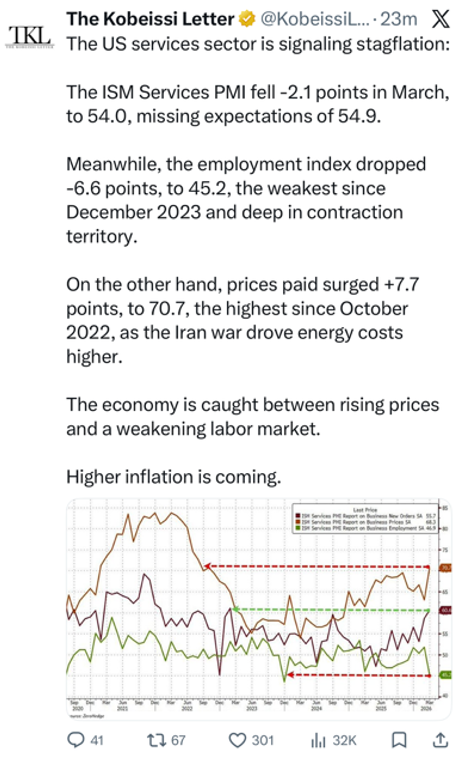
The new cycles continue to alarm us, and the markets continue to baffle us, but we'll break down a few things in the month's post! We touch lightly on how the war in Iran has affected the market, along with our performance numbers and market summary.
Money is a tool. It's something that supports your life!

Portfolio Management Comment
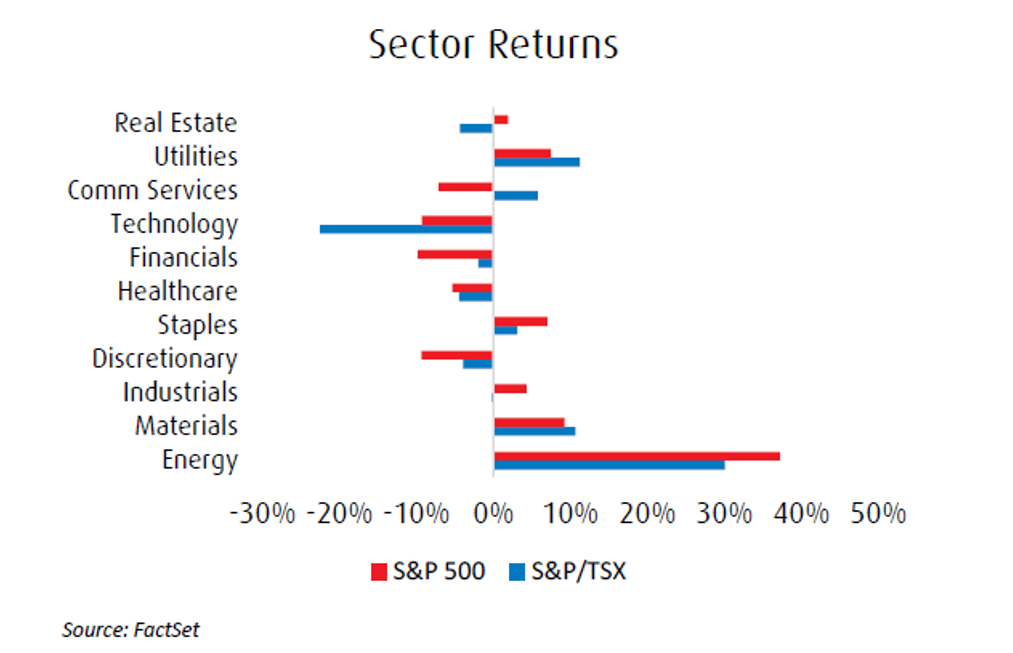
North American equity markets were mixed through the first quarter of 2026, following a strong rally late last year. U.S. equities experienced pronounced sector rotation during the quarter, as investors moved away from high growth and mega cap technology toward energy, materials, and defensive sectors. This shift was driven by heightened geopolitical tensions in the Middle East, rising energy prices, and valuation concerns, alongside growing debate around AI related disruption within parts of the technology complex. The Canadian equity market proved to be more resilient, largely on the back of its exposure to commodities. Nevertheless, it too experienced volatility and meaningful sector rotation. The Canadian market had out sized returns in February, driven by its exposure to precious metals, which were up meaningfully over the month. But those gains receded in March, with precious metals retreating at the onset of the war in Iran. Not surprisingly, the Energy sector was a strong performer in the month of March given the risk of supply disruptions in the Middle East.
Macro risks are more elevated than they were at the beginning of the year. The war in Iran, and the evolving nature of the conflict, have added uncertainty to the investment environment. Regardless of the conflict’s outcome, which remains very difficult to predict, damage to infrastructure and supply chains across several commodities has already occurred. Meanwhile, concerns remain around the security and stability of the Strait of Hormuz, an important choke point responsible for roughly 20% of seaborne crude oil and natural gas shipments. As a result, disruptions to the supply of several commodities may be longer lasting. If sustained, these conditions could increasingly weigh on the earnings outlook—an area that has supported markets to date but is not immune to change. We positioned the portfolio for a potential broadening of earnings growth with more exposure to cyclical areas of the market. We continue to have conviction in this positioning but will continue to closely monitor developments in the Middle East to assess implications to the outlook.
Our Portfolio Management Approach
We are a team that uses technical analysis to manage short-term market risks. We believe that risk management is not a choice, but a necessity. While we cannot control how much downside the market provides during a correction, we can control how much of the downside your account receives. We aim to avoid 60% or more of the decline in any significant downturn. Without our process, there is a good chance you will experience 100% of the downside from the market. We will help you navigate the risks and rewards of the market so that you can stop worrying about your money and start living your life.
Transactions
The following is a chronological list of the trades done in March, 2026:
- When the US started their “war” with Iran we sold our International ETF’s realizing profits and trimmed our Hudbay Minerals
- We sold ZDI for $28.862 purchasing it for $27.44
- We sold VIDY for $41.66 purchasing it for $36.65
- We trimmed the Hudbay at $28.28 purchasing it for $14.42
- Our TD bond was called and replaced with a TD bail in fixed floater maturing in 2034 yielding 4.21%
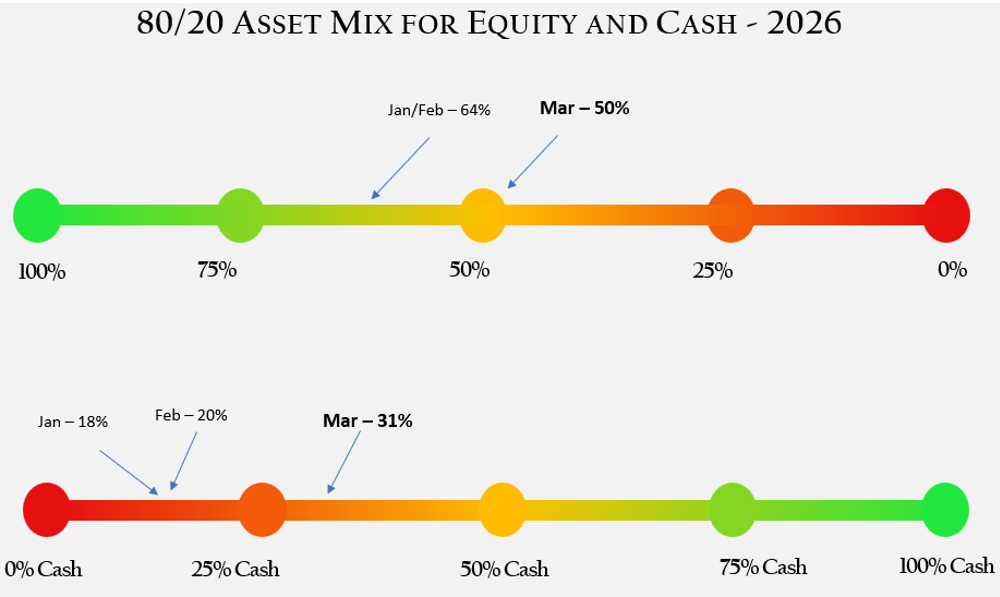
- We are currently sitting with around 30% cash, solidly outperforming the markets in April
- Year to date the TSX was up 3.3%, the SPY was down 4.63%, Nasdaq was down 7.11% and bonds were down 1%.
- We are looking to add to positions
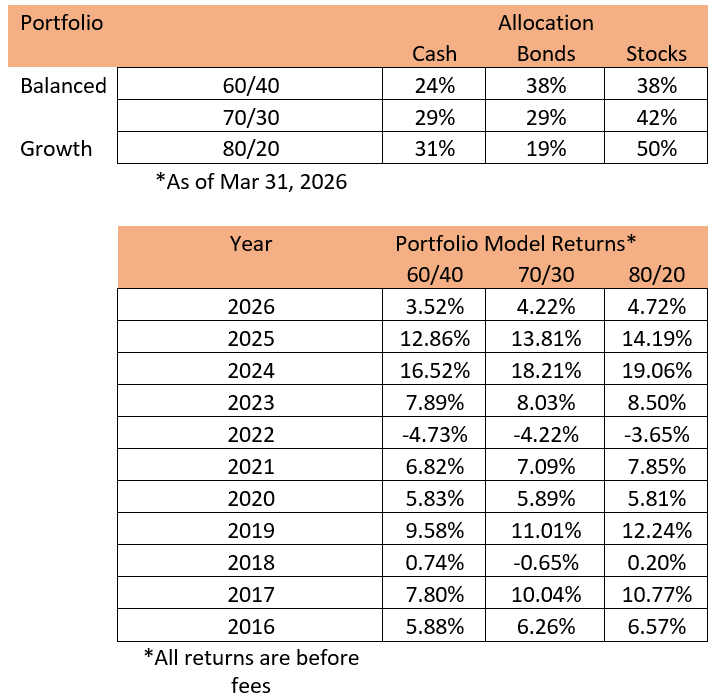
Returns on our 60/40, 70/30 & 80/20 Portfolios, before fees:
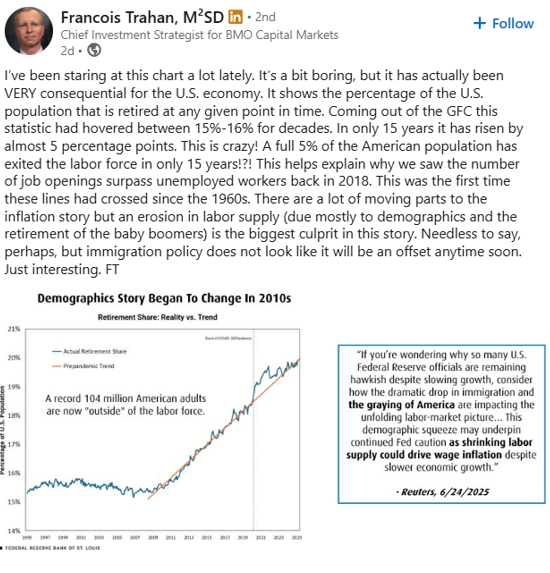
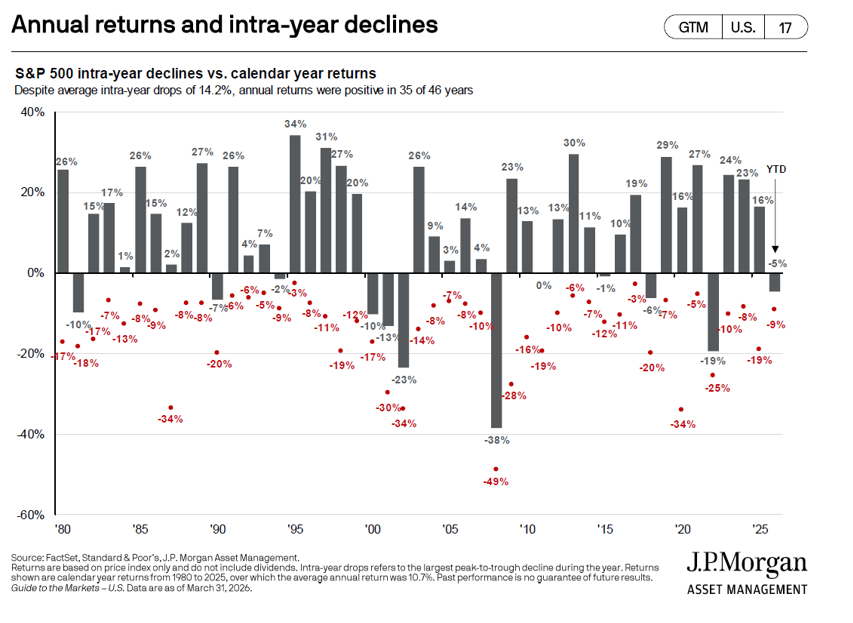
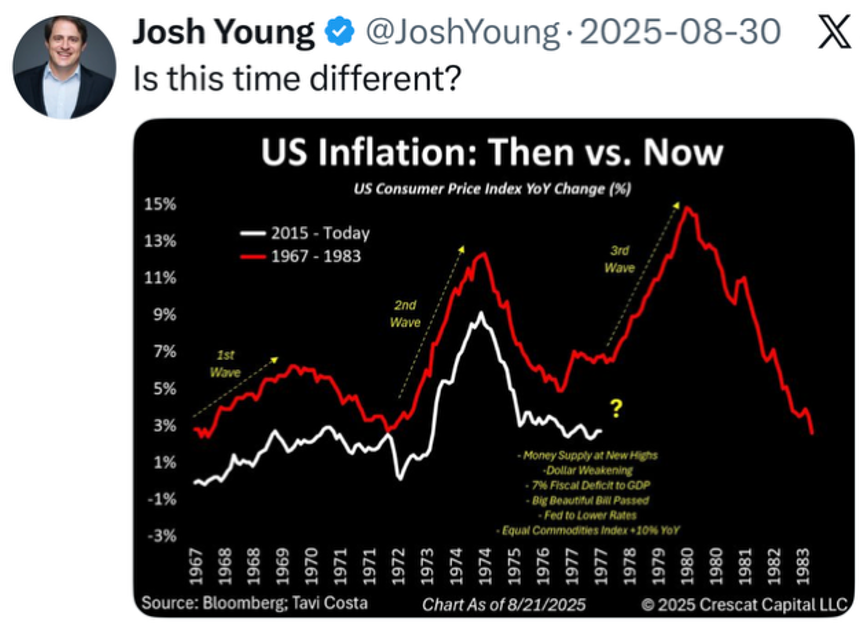
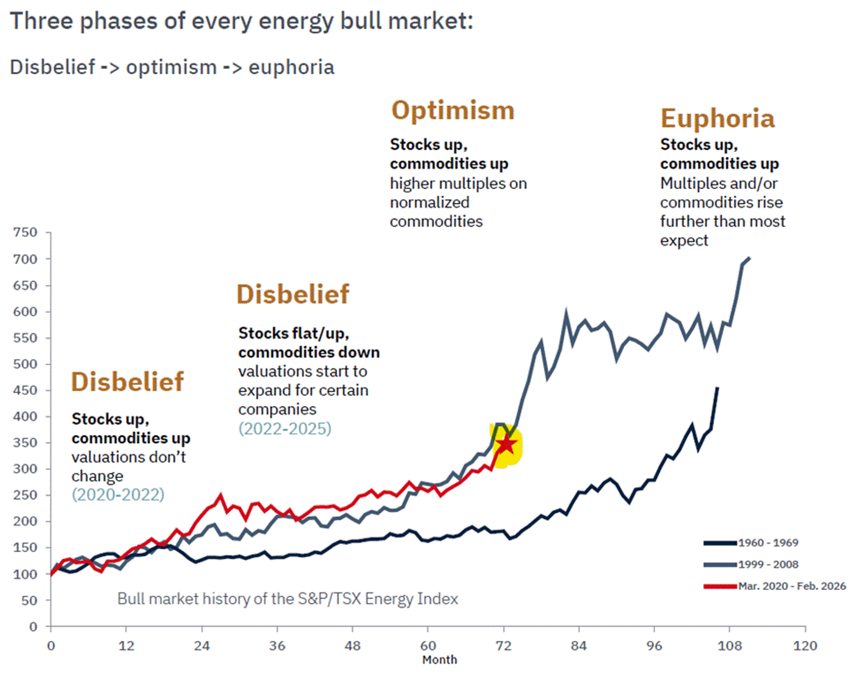
Interesting Charts
Technical Comment
Market Overview: S&P 500 E-mini Futures
The market formed an E-mini pullback to the 20-month EMA, with a long lower tail. Bulls want the 20-month EMA to act as support followed by a retest of the all-time high. Bears need sustained follow-through selling below the 20-month EMA to increase the odds of a successful reversal.
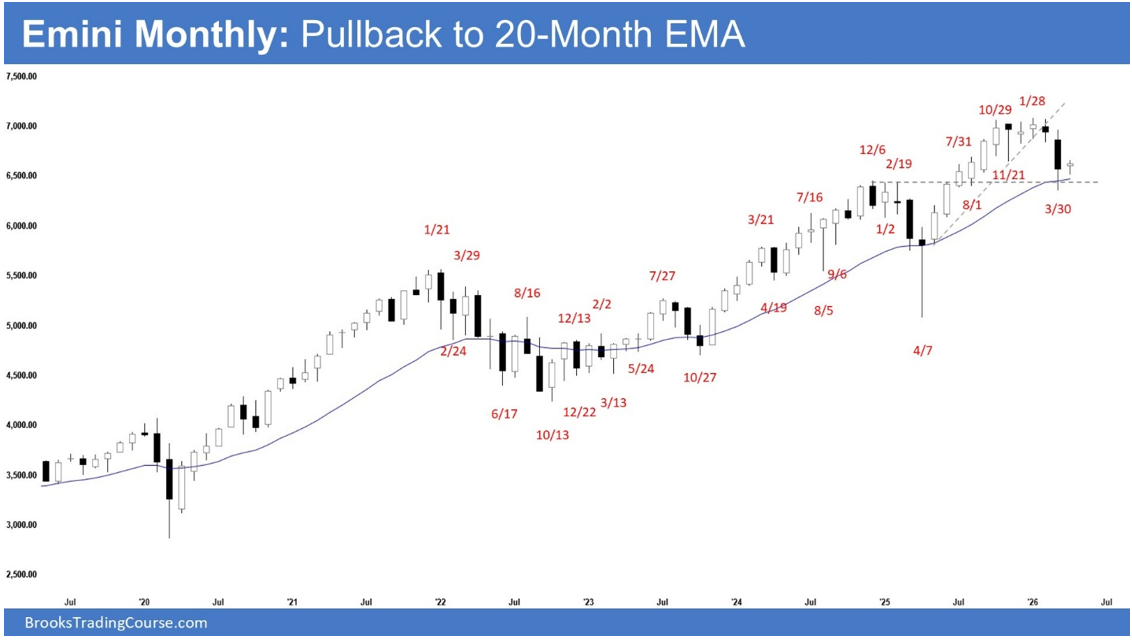
- March formed a bear bar closing below the midpoint of its range, with a long lower tail.
- Last month, we said traders would watch for a breakout in either direction from the tight range and the strength of follow-through. Until then, the market may continue oscillating within it in the near term.
- The market broke below the tight trading range, testing the 20-month EMA.
- Bulls see the move as a pullback testing the 20-month EMA and hope it has relieved the prior overbought condition.
- They want the pullback to be weak and sideways, with overlapping bars and prominent lower tails.
- Bulls want a major higher low, followed by a retest of the all-time high.
- They see a large double bottom bull flag (April 7 and March 30) and want a third leg sideways to up (following December 6 and January 28), lasting many months.
- Bulls want the 20-month EMA to act as support.
- Bears got a pullback from a large wedge pattern (July 27, December 6, and October 29) and a micro double top (October 29 and January 28).
- They achieved a measured move to 6,500 based on the height of the 3-month tight trading range.
- Next, they want a larger measured move to 6,200, based on the height of the broader trading range (November 21 low to January 28 high).
- Bears need sustained follow-through selling below the 20-month EMA to increase the odds of a successful reversal.
- If the market trades higher, bears see it as a retest of the prior high and want a lower high major trend reversal, followed by a second leg sideways to down.
- The market formed a pullback testing the 20-month EMA.
- It has broken below the 10-month bull trend line, indicating increasing selling pressure.
- The long tail below the bar suggests bears are not yet decisively strong.
- Traders may expect a retest of the prior high (January 28), forming either a lower high or a higher high.
- If the market trades higher, traders will watch the strength of the move—whether it breaks strongly above the March high or stalls with prominent upper tails, overlapping bars, or bear bodies.
- For now, traders will watch whether bears can generate follow-through selling in April, or if the market instead retests the prior high.
Millennial Minute
Another month, another article about scams and how to keep yourself safe.
Have you ever had to click a box to verify you're a human? Or click a series of pictures until there are no more bicycles left? Those are CAPTCHA prompts, and they are helpful in verifying real people and weeding out 'bot' accounts.
CAPTCHA is a great tool for protecting your information online - so, of course scammers are going to try to use it to access your information.
Click here to read more about CAPTCHA scams and how you can protect yourself.
Planning Article
How Critical Illness and Disability Insurace Fit Together in a Wealth Plan
Our greatest and most valuable asset is usually ourselves. Our human capital – both intellectual and physical – allows us to earn a livelihood, and live the life that each of us chooses. But when a severe disability or illness strikes, it may impact our ability to earn a living and continue with our daily lives as we did before. Insurance is all about managing this risk and is a valuable strategy to protect our income earning ability and well-being, both personally and financially.


DISCLAIMER:
The opinions, estimates and projections contained herein are those of the author as of the date hereof and are subject to change without notice and may not reflect those of BMO Nesbitt Burns Inc. (\"BMO NBI\"). Every effort has been made to ensure that the contents have been compiled or derived from sources believed to be reliable and contain information and opinions that are accurate and complete. Information may be available to BMO NBI or its affiliates that is not reflected herein. However, neither the author nor BMO NBI makes any representation or warranty, express or implied, in respect thereof, takes any responsibility for any errors or omissions which may be contained herein or accepts any liability whatsoever for any loss arising from any use of or reliance on this report or its contents. This report is not to be construed as an offer to sell or a solicitation for or an offer to buy any securities. BMO NBI, its affiliates and/or their respective officers, directors or employees may from time to time acquire, hold or sell securities mentioned herein as principal or agent. BMO NBI -will buy from or sell to customers securities of issuers mentioned herein on a principal basis. BMO NBI, its affiliates, officers, directors or employees may have a long or short position in the securities discussed herein, related securities or in options, futures or other derivative instruments based thereon. BMO NBI or its affiliates may act as financial advisor and/or underwriter for the issuers mentioned herein and may receive remuneration for same. A significant lending relationship may exist between Bank of Montreal, or its affiliates, and certain of the issuers mentioned herein. BMO NBI is a wholly owned subsidiary of Bank of Montreal. Any U.S. person wishing to effect transactions in any security discussed herein should do so through BMO Nesbitt Burns Corp. Member-Canadian Investor Protection Fund.
BMO (M-bar roundel symbol)” is a registered trademark of Bank of Montreal, used under licence.